
Updated on February 20, 2023.
The Elliott Wave Theory trading method is considered an advanced technical analysis approach that might offer in-depth understanding of price movements. This theory suggests that price changes follow some long-term patterns. If traders manage to identify them, it may enhance their trading method. Today we will look at the basics of this approach and see how it may be applied in trading.
Elliott Wave Theory Explained
Back in the 1930s an American economist Ralph Elliott started analyzing hourly, daily, weekly, monthly and yearly price charts of various indices. His goal was to identify consistent patterns in the market activity. He believed that there was a reason for every price movement. So he went through charts covering 75 years of stock market data to prove his theory.
After years of research, Elliott concluded that even though market activity may sometimes seem random and scattered, in reality it follows certain rules. Which means that traders may be able to use them to achieve their trading objectives.
Currently, the Elliott wave theory trading principles are viewed as a general set of market behavior patterns. The Elliott wave trading results may depend on understanding the concepts of this theory, so let’s go over the main ideas.
What Are Elliott Waves?
Trading with the Elliott wave theory involves tracking waves – a series of repeating price movements. The theory suggests that prices follow 2 main wave patterns: impulse (motive) and corrective.
Impulse (Motive) Waves
Impulse (motive) wave sequence consists of 5 smaller waves: 3 large price movements in the direction of the uptrend and 2 corrections.
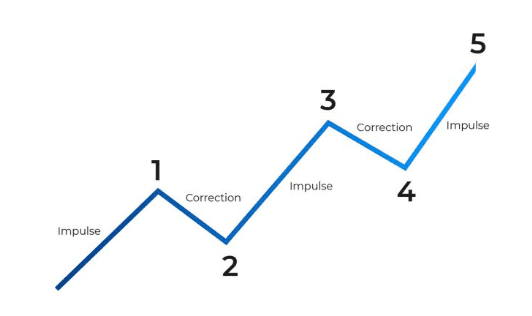
These waves are labeled waves 1, 2, 3, 4 and 5 respectively.
To identify these waves correctly, traders should keep in mind the following rules.
✍️
- The third wave (second impulse wave) is usually the largest of the sequence. Waves 1 or 5 cannot be longer than wave 3.
- Wave 2 never goes beyond the low of wave 1. It is typically 60% the length of the wave 1.
- The high of wave 3 must be higher than the high of wave 1 (otherwise it is necessary to start the wave count again). The waves should be making progress.
Corrective Waves
The corrective wave sequence, according to the Elliott wave theory trading principles, consists of 3 waves: an impulse down, a correction to the upside and another impulse down. These waves are labeled A, B and C. As a rule, corrective waves A, B and C usually end in the area of the prior wave 4 low.
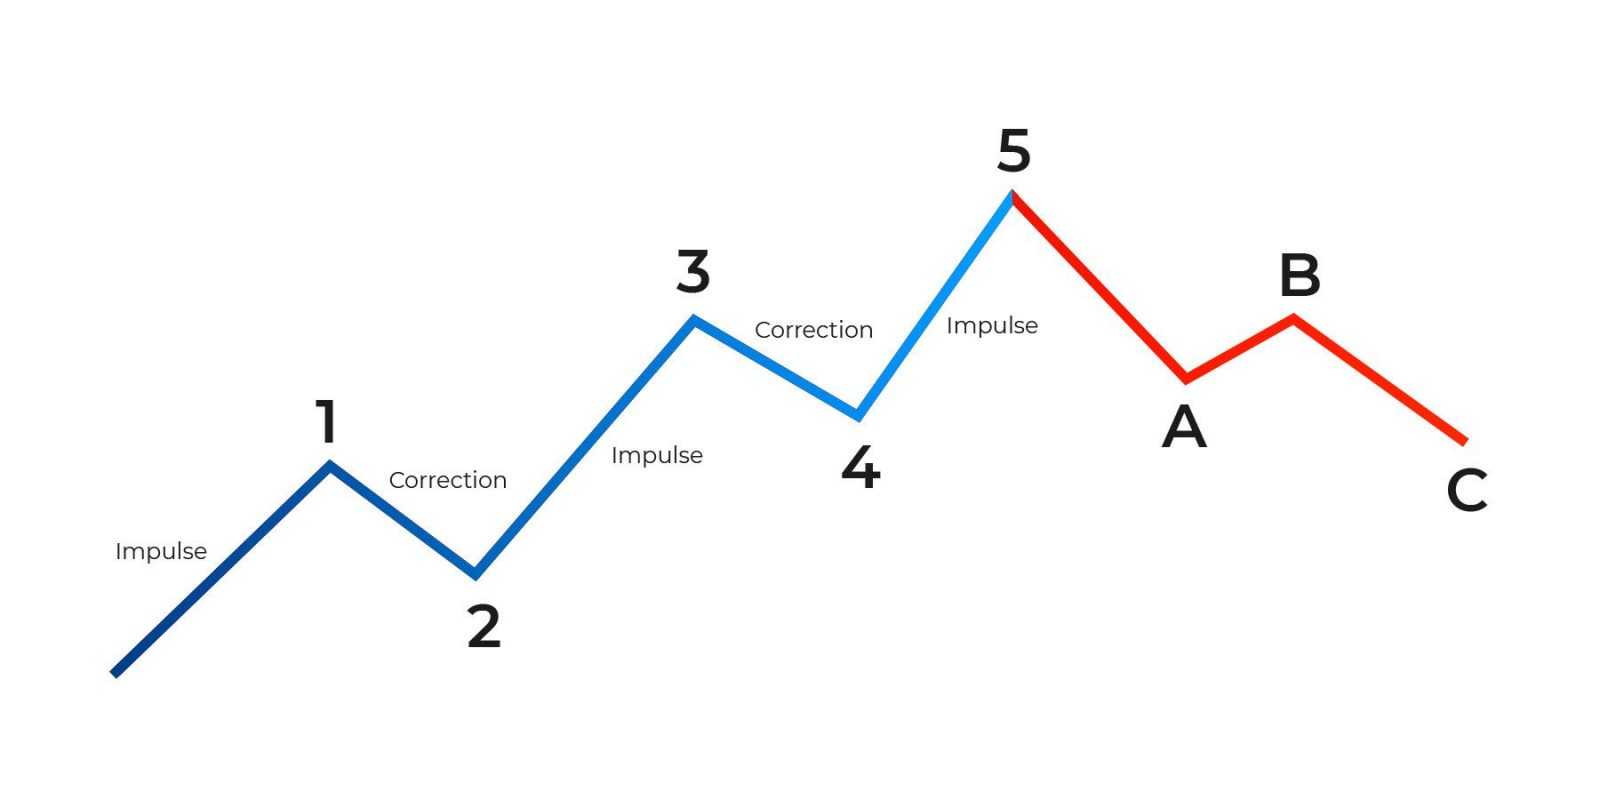
Both motive and corrective waves can be seen in the picture above. It is important to pay attention to the length of the waves as well as their proportions.
How to Use Elliott Wave Theory for Trading?
When trading with the Elliott wave theory, it’s important to keep in mind the rules of the waves sequence described above. It may not be easy to identify these patterns right away, as there are many rules to keep in mind. However, you may learn how to use the Elliott waves correctly and get more accurate results over time.
What you should remember is that, according to the Elliott wave trading principles, prices move in cycles. This means that you may be able to predict an upcoming price reversal. And then use this information to open or close a deal at the optimal moment.
For example, such a structure can be found on a monthly chart on the Amazon stock. It is clearly visible that the price first climbed upwards in a cycle of 5 waves, followed by 3 corrective waves.
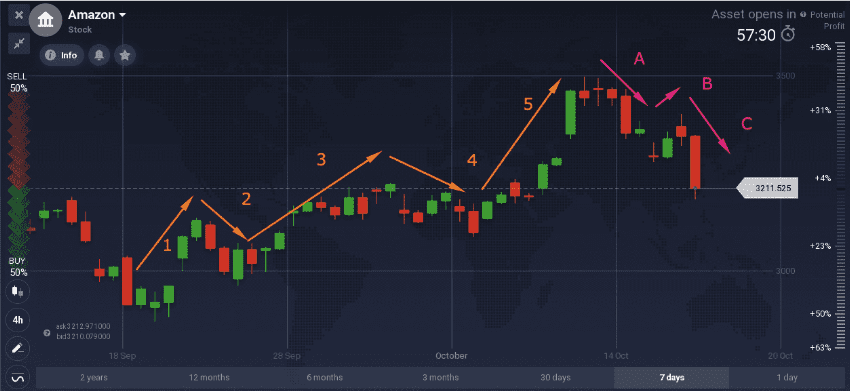
Finding the waves and analyzing the chart in this way may help traders make trading decisions. For instance, they may choose to enter a long (BUY) position during the pullbacks (corrective waves) of an uptrend. By doing this, they might be able to “ride” the following uptrend as the price rises to the next high.
When it comes to cases where the Elliott wave downtrend is revealed, it may be possible to open a short (SELL) trade during corrective waves in a downtrend. This may allow traders to possibly benefit from the market trending down. However, it is important to note that there is no guarantee of 100% correct indications.
✍️ FAQ
Does Elliott Wave Theory Work in Forex?
The Elliott wave theory trading principles are most commonly used for stock trading. However, it may also be applied to technical analysis of different assets, including Forex.
Can I Use the Elliott Wave for Intraday Trading?
The Elliott wave trading principles may offer valuable insights into long-term price movements. Still, if traders manage to identify recurring patterns in price changes, they may learn how to use the Elliott wave theory in their intraday trading as well.
Is the Elliott Wave Theory Accurate?
When using any technical analysis tool, keep in mind that they do not provide any kind of certainty about future price movement. But they may be helpful in predicting potential price movements. Consider combining trading with the Elliott wave theory with other forms of technical analysis, including technical indicators, to identify specific opportunities.
