“The trend is your friend,” they say, and insist you follow it until the very end. But what if you strip away all that long-term trend noise so you can focus on the shorter cycles? Enter the Detrended Price Oscillator (DPO) — the indicator that zooms into the details while everyone else is zooming out.
Here’s everything you need to know about the DPO and how to use it.
What Is the DPO?
The Detrended Price Oscillator’s job is to remove the influence of a long-term trend from price data. Why would you want to do that? Isn’t trading all about following trends?
Turns out, sometimes trends get in the way. If you’re trying to figure out how long a trend will last or when it might reverse, all that trend-related noise can cloud your judgment. By removing the trend, the DPO helps you focus on shorter-term price cycles and makes it easier to spot patterns.
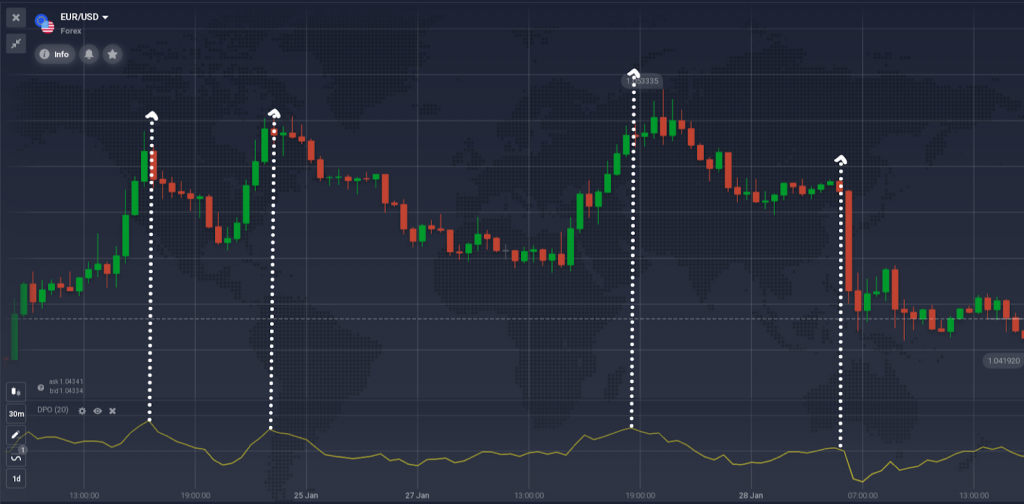
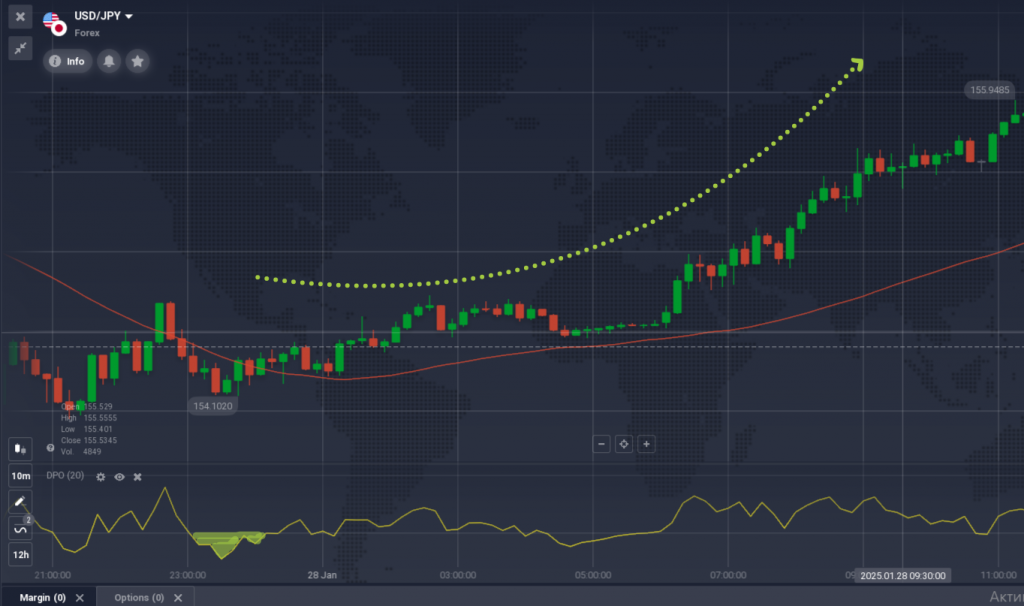
Here’s what it looks like in action: the DPO creates a curve that’s similar to the price chart but without the overarching trend. It uses a moving average shifted to the left and compares past prices to that moving average. This gives you a clearer picture of price fluctuations.
How to Set Up the DPO
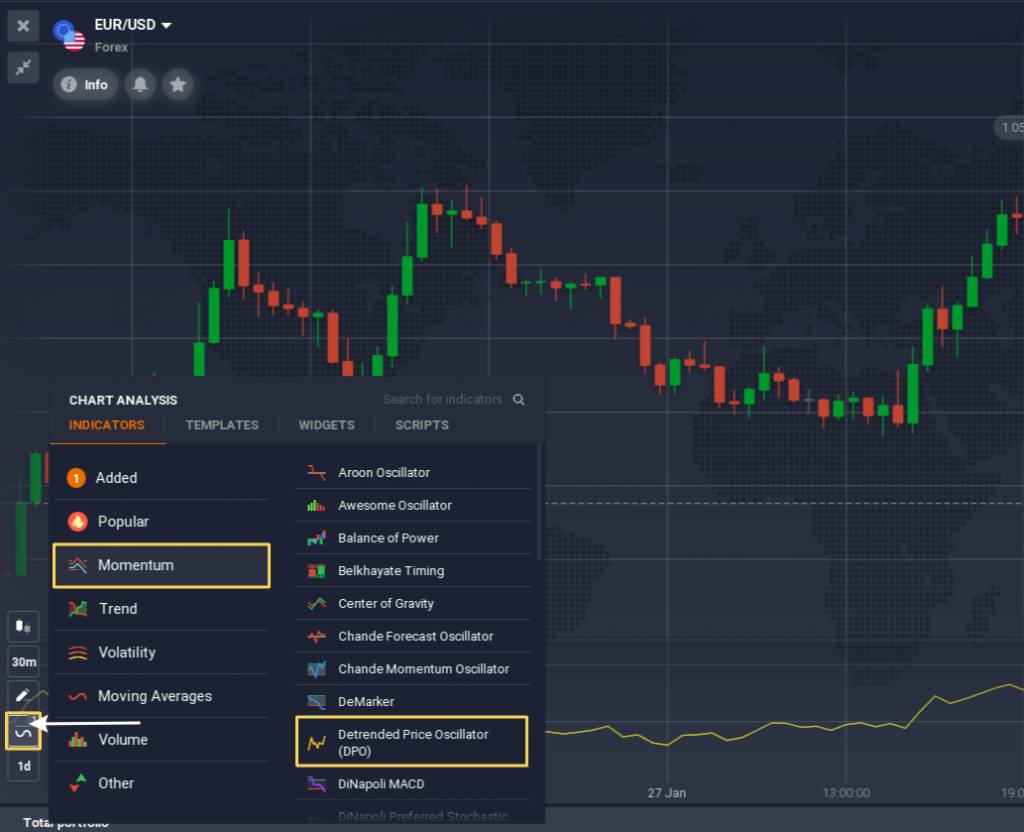
- Find the Indicator Panel: Look for the “Indicators” button in the bottom-left corner of your Traderoom.
- Choose DPO: Go to the “Momentum” tab and select “DPO” from the list.
- Adjust Settings (Optional): Stick with the default settings or customize the period and baseline. Want more sensitivity to short-term movements? Reduce the period. Want fewer false signals? Increase it.
- Click “Apply” and you’re done.
How to Use the DPO in Trading
Now that your DPO is set up, let’s talk about what you can do with it. The DPO measures the difference between past prices and a shifted moving average:
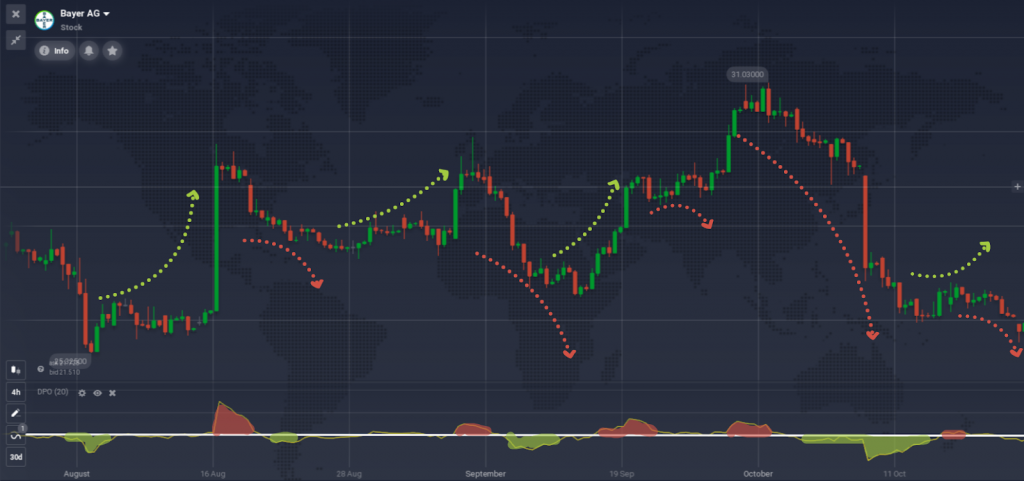
- When the price is above the average, the DPO is positive.
- When it’s below, the DPO is negative.
Here are a few ways to put the DPO to work.
1. Short-Term Trading
If you’re a short-term trader who couldn’t care less about long-term trends, the DPO is your new best friend. By focusing on shorter price fluctuations, you can:
- Identify the extent of the current price movement.
- Spot highs and lows in shorter cycles.
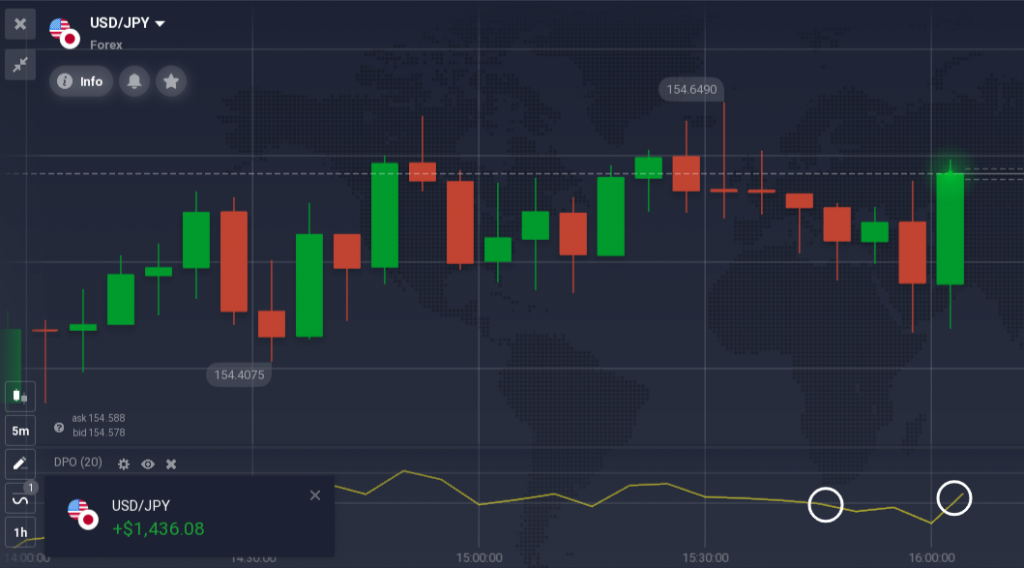
Example: Let’s say you’re trading on a 1-hour chart. Check the DPO before placing a trade. If it crosses above the zero line, it might be time to sell. If it goes below the zero line, consider buying.
2. Estimate Cycle Lengths
Markets love repeating themselves. Periods of growth are often followed by declines, and the DPO can help you measure the time it takes for these cycles to complete. Here’s how:
- Look for consecutive highs and lows on the DPO.
- Measure the distance between them.
Example: If you’re trading CFDs on a stock, use the DPO to estimate how long it typically takes for the price to rise and fall. When the current cycle nears its historical average, prepare for a potential reversal.
3. Combine the Detrended Price Oscillator with other Indicators
The DPO is great on its own, but it’s even better when paired with other tools:
- DPO + Moving Average: Use a moving average to identify the overall trend while the DPO focuses on shorter cycles. For example, combine the DPO with a 50-period moving average. When the price is above the moving average and the DPO hits a low, it’s a signal to buy. When the price is below the moving average and the DPO hits a high, it’s time to sell.
- DPO + MACD: The MACD can confirm whether the market momentum aligns with what the DPO is showing. If both suggest a reversal, that’s a stronger signal.
- DPO + Trend Lines: Draw trend lines on your price chart and use the DPO to confirm breakouts or bounces off key levels.
Pro Tips for Using the DPO
- Don’t Rely on It Alone: The DPO is best used as a supportive tool. Always pair it with other indicators for confirmation.
- Beware of False Signals: Like any indicator, the DPO isn’t perfect. Use it alongside other analysis methods to avoid unnecessary losses.
- Adjust Settings Based on Your Time Frame: Shorter periods make the Detrended Price Oscillator more sensitive but can lead to more noise. Find the right balance for your trading style.
Conclusion
The Detrended Price Oscillator is a powerful tool for traders who want to cut through the noise of long-term trends and focus on shorter-term cycles. Use it to identify cycle lengths, time reversals, or combine it with other indicators.
But like all tools, it’s only as good as the trader using it. Pair it with other indicators, keep an eye out for false signals, and practice using it on a demo account before going live.
