
Ready to chomp down on some serious profits? The Alligator and Fractal strategy is here to help you navigate the wild waters of trading! Picture this: the Alligator, with its powerful jaws, snaps up market trends, while the Fractal acts as your compass, pointing to key entry and exit points. Together, they form a dynamic duo that can turn any trader into a market beast.
Whether you’re a seasoned pro or just dipping your toes in, mastering the Alligator and Fractal strategy will have you trading like a predator in no time. Dive in with us as we unravel this exciting trading combo and show you how to make the most of it!
What is the Alligator?
The Alligator indicator is a technical analysis tool consisting of three lines on the price chart. They represent the jaw, the teeth and the lips of the named animal. The main purpose of the Alligator is to determine the trend and predict its future direction.
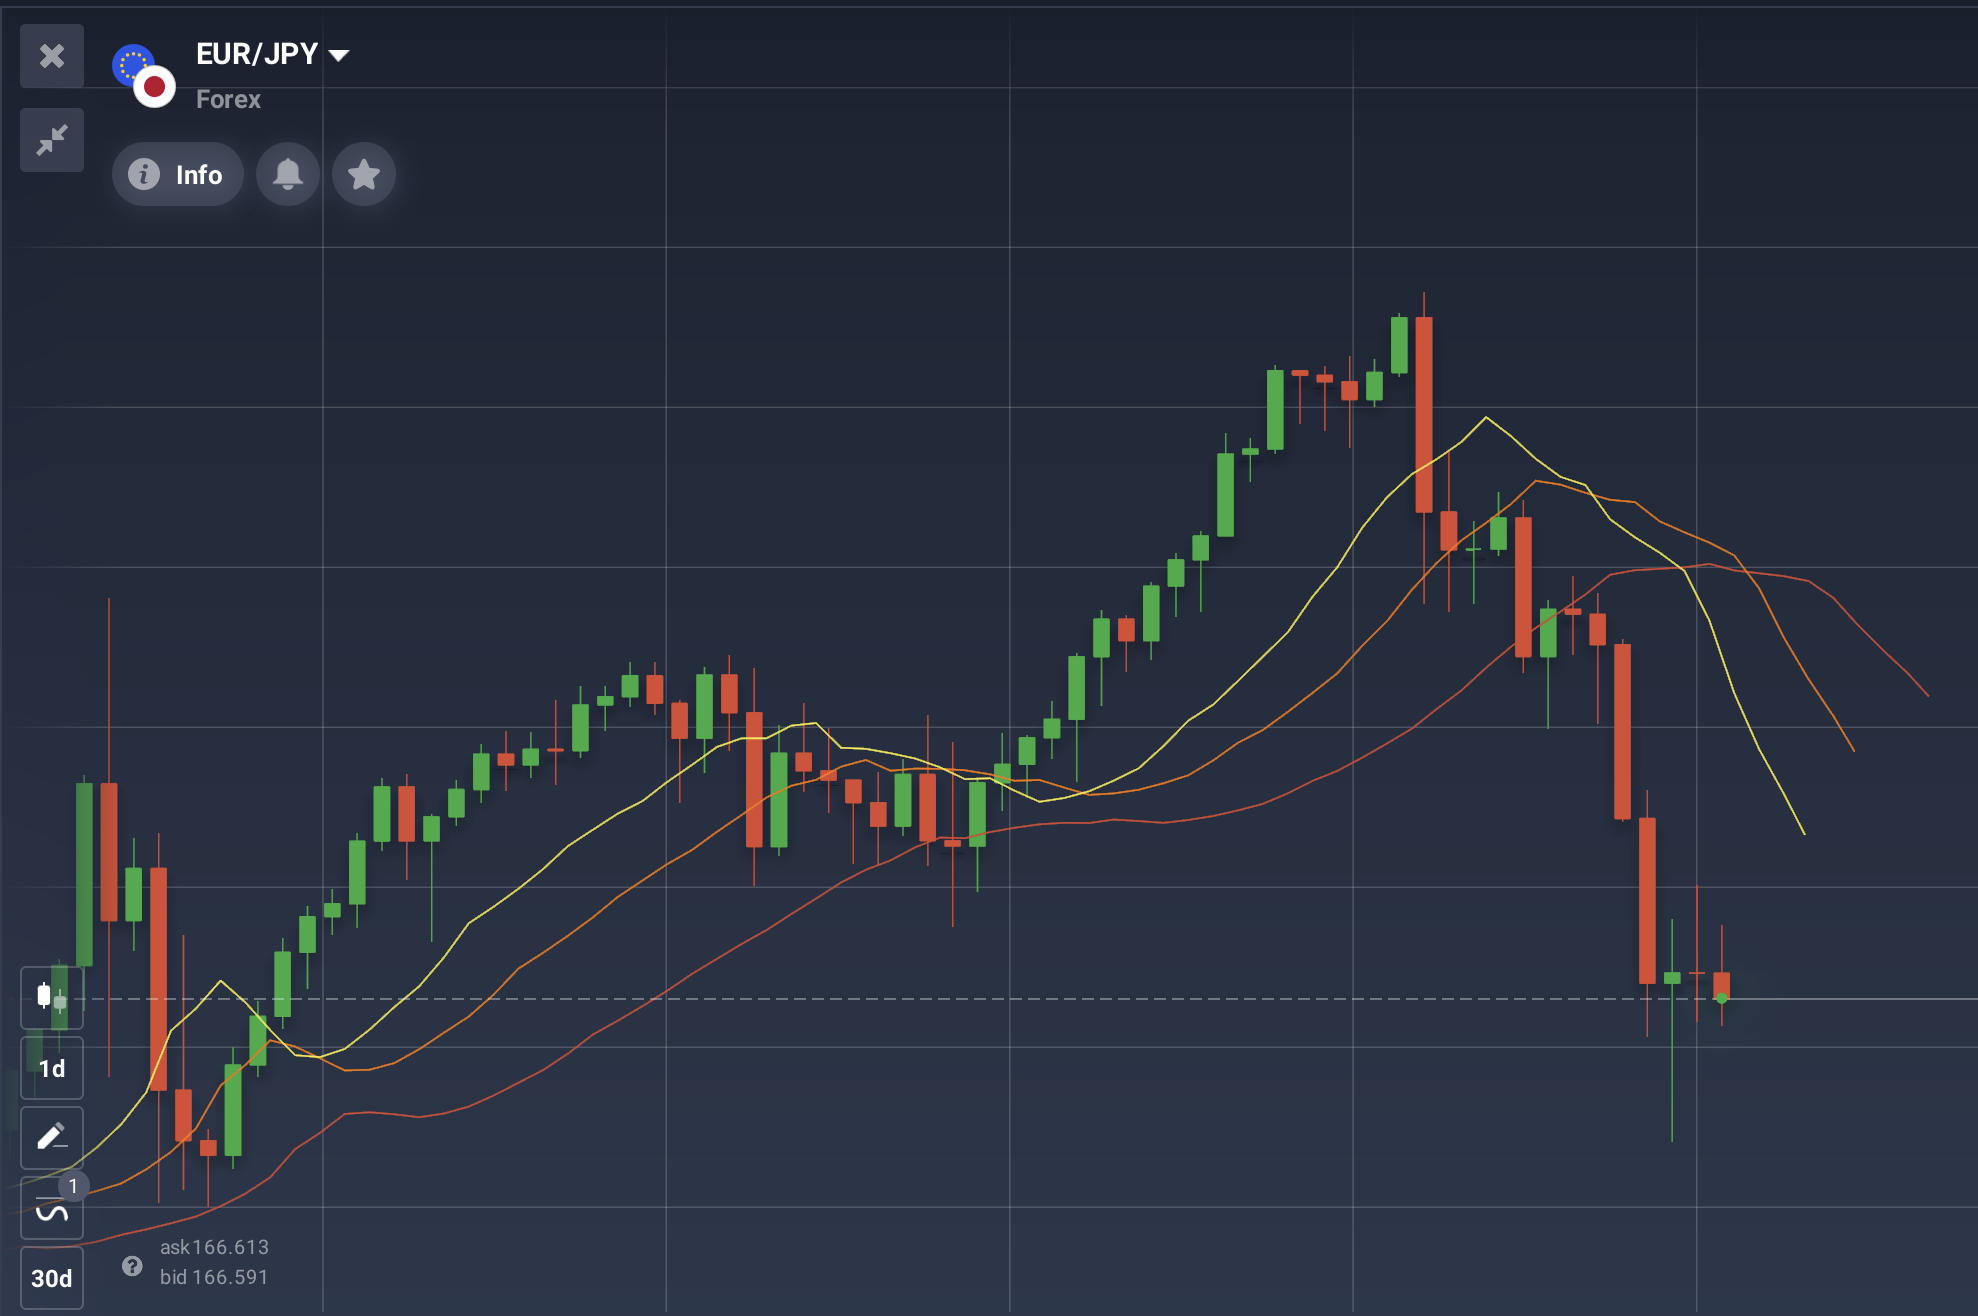
The Alligator indicator is a combination of three smoothed moving averages with periods of 5, 8 and 13, which are all Fibonacci numbers. Each line is shifted ahead for a specific period of time that depends on the short- or long-term orientation of that particular line.
1) The Alligator’s Jaw (red) is a 13-period SMA, moved into the future by 8 bars;
2) The Alligator’s Teeth (orange) is an 8-period SMA, moved into the future by 5 bars;
3) The Alligator’s Lips (yellow) is a 5-period SMA, moved into the future by 3 bars.
The same analogy is used to describe the way the indicator works. Sideways trends are marked with the alligator’s closed mouth — all three lines approach each other and occasionally intersect. This is when the alligator is asleep, and the majority of careful traders avoid making new deals.
The longer the alligator is waiting, the hungrier it gets. Long periods of sideways trends are interspersed with strong bullish/bearish periods, and this indicator is perfectly suited to catch these moments.
So what about the Fractal indicator? How can it improve the signals provided by the Alligator?
Bearish and bullish signals from the Fractal indicator
The main goal of the Fractal is to predict potential reversals in the trend. This tool’s signals are based on recurring patterns in the market that can predict reversals among larger, more chaotic price movements. This means that the Fractal indicator can help identify emerging trends and warn traders of upcoming opportunities. On the IQ Option platform, the Fractal’s signals are reflected as a series of 5 candlesticks with green or red arrows on the price chart. These arrows may indicate bearish or bullish trends for a chosen asset.
Bearish sentiment: a bearish trend occurs when there is a pattern with the highest high in the middle and two lower highs on each side.
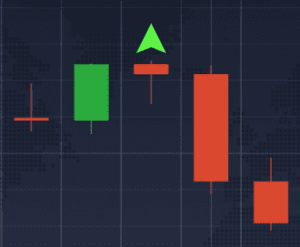
In this case, you’ll see a green arrow pointing up that hints at a potential upcoming change to a more bearish pattern.
Bullish sentiment: a bullish trend may be observed when there is a pattern with the lowest low in the middle and two higher lows on each side.
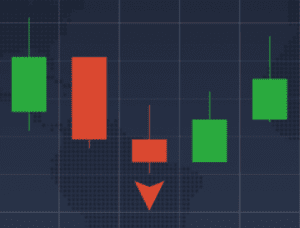
Here’s where the down arrow comes in: it indicates that a bullish trend may be coming soon.
As we already mentioned, the Fractal indicator points to a pattern of 5 candlesticks. The bearish or bullish arrows are shown above or below the middle bar. They appear only after the 5 candle pattern is confirmed, not before. So traders can consider using this signal and entering a trade in the next few bars after the arrow’s appearance.
Alligator and Fractal strategy set-up
Setting up these indicators in the IQ Option trading platform is easy.
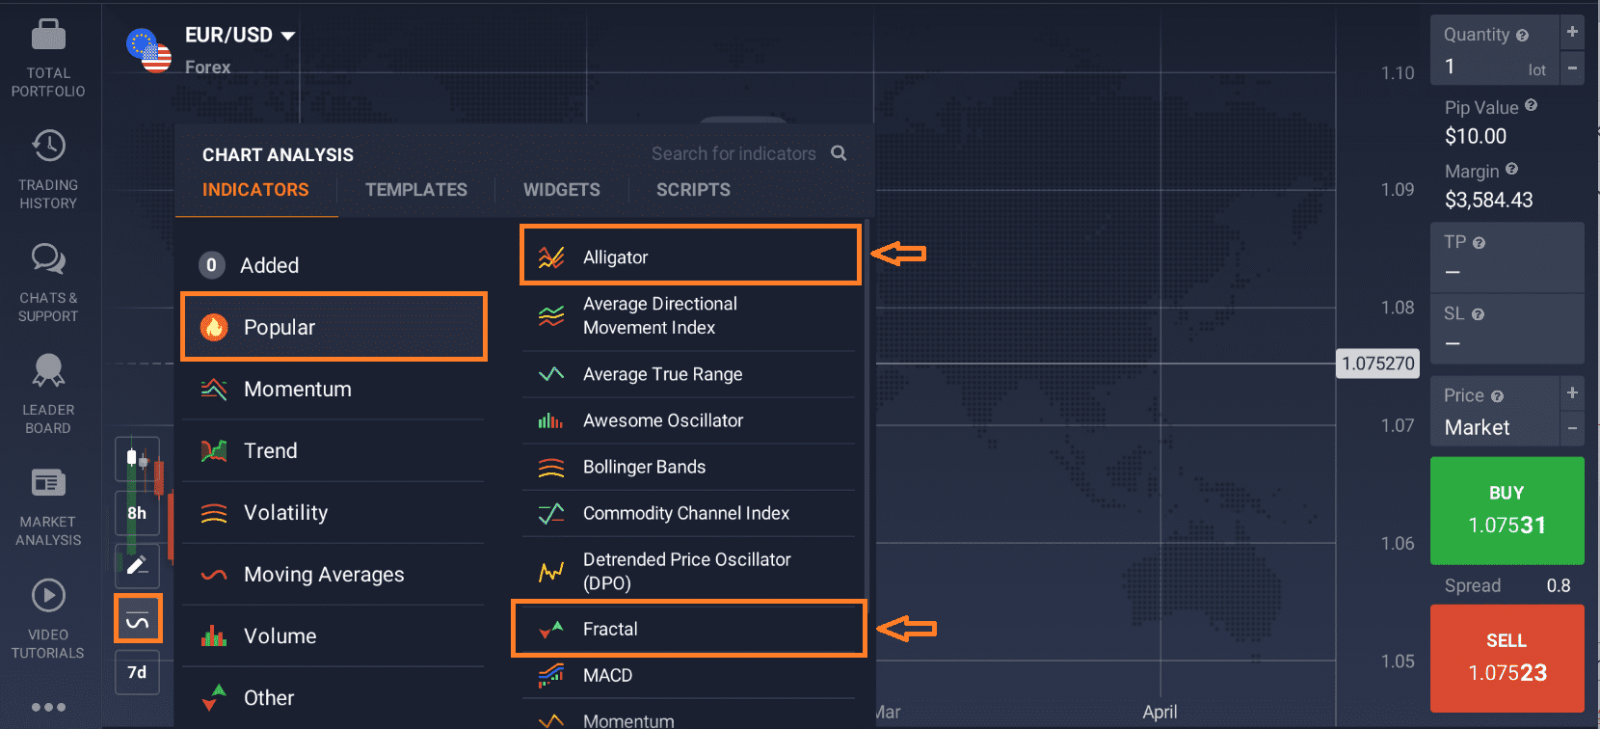
To activate the Alligator, click on the “Indicators” section in the bottom-left corner of the screen and go to the “Popular” tab. Then choose “Alligator” from the list of available tools.
Click the “Apply” button without changing the settings. The Alligator graph will then be overlaid on the price chart.

To activate the Fractal, go back to the “Indicators” section in the bottom-left corner of the screen and check out the “Popular” tab. Then choose “Fractal” from the list.
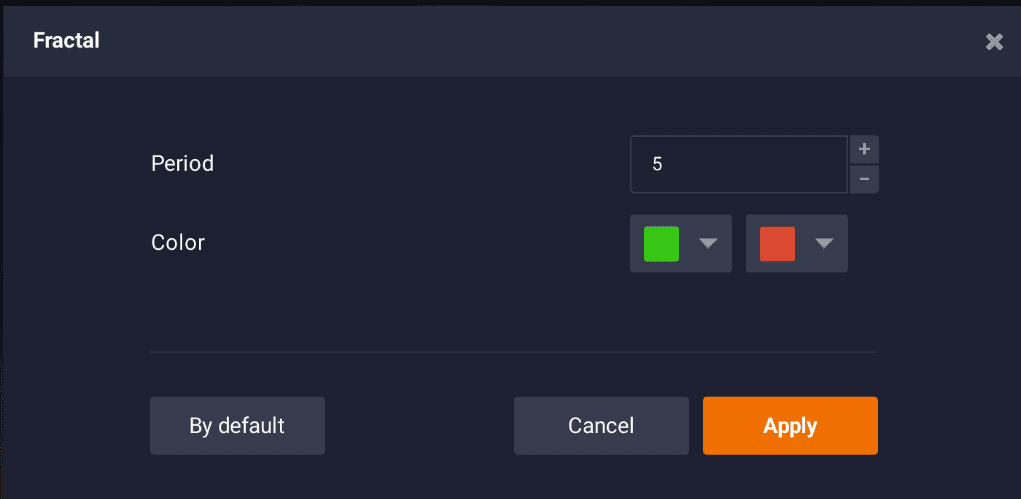
Click the “Apply” button without changing the settings. Fractal indicator will then be overlaid on the price chart.
How to use the Alligator and Fractal strategy?
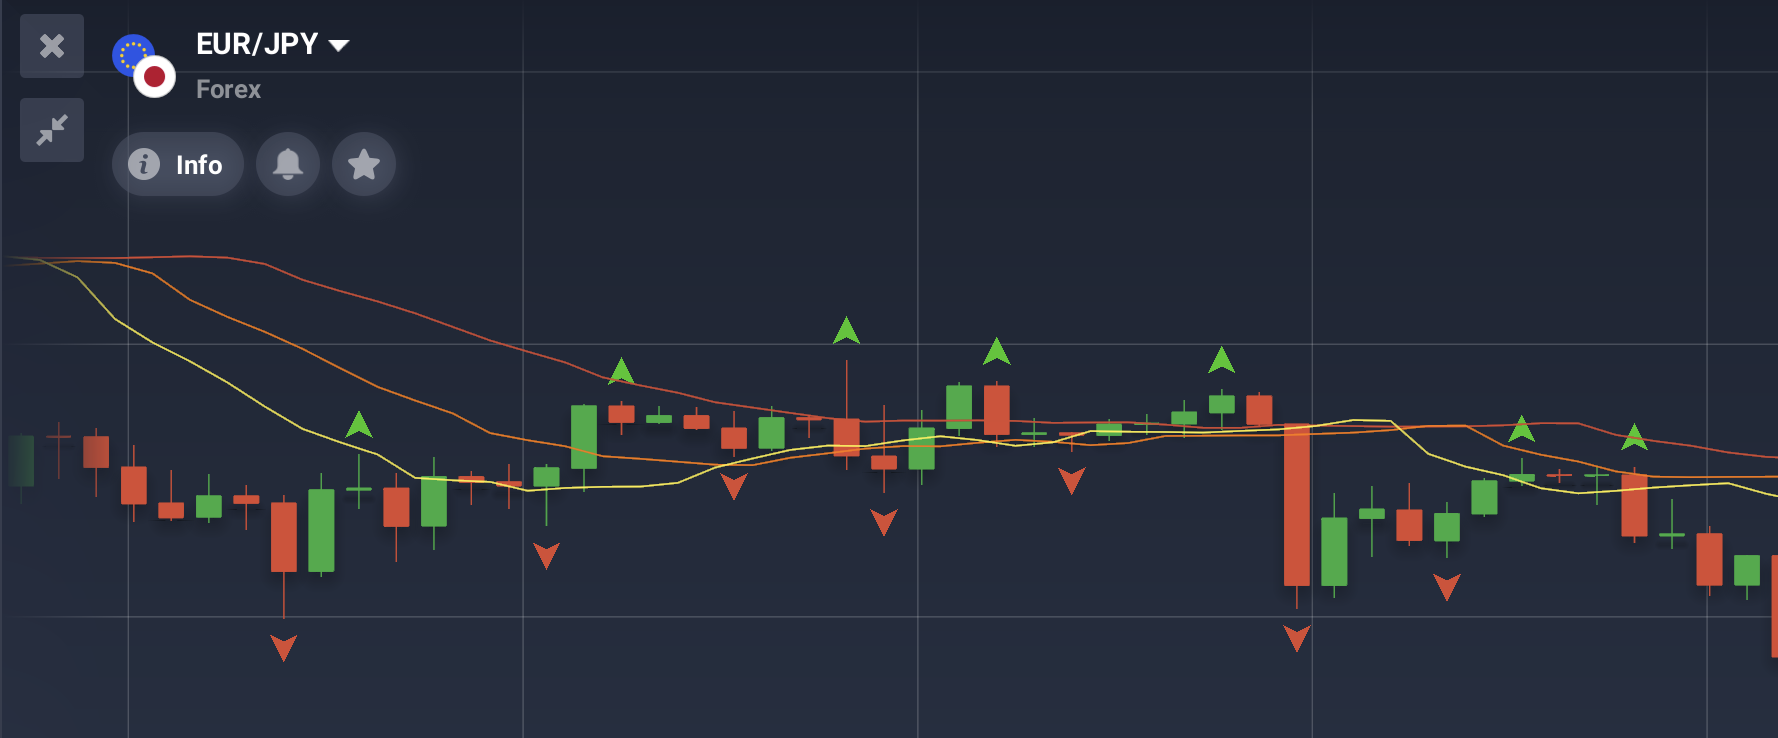
Though each indicator can be used separately, Fractal and Alligator work best when used simultaneously to confirm each other’s signals. Generally, all bullish (Buy) signals provided by the Fractal can be considered valid only if they appear below the Alligator’s central line (orange). Similarly, all bearish (Sell) signals should be above the Alligator’s central line (orange) to be valid.
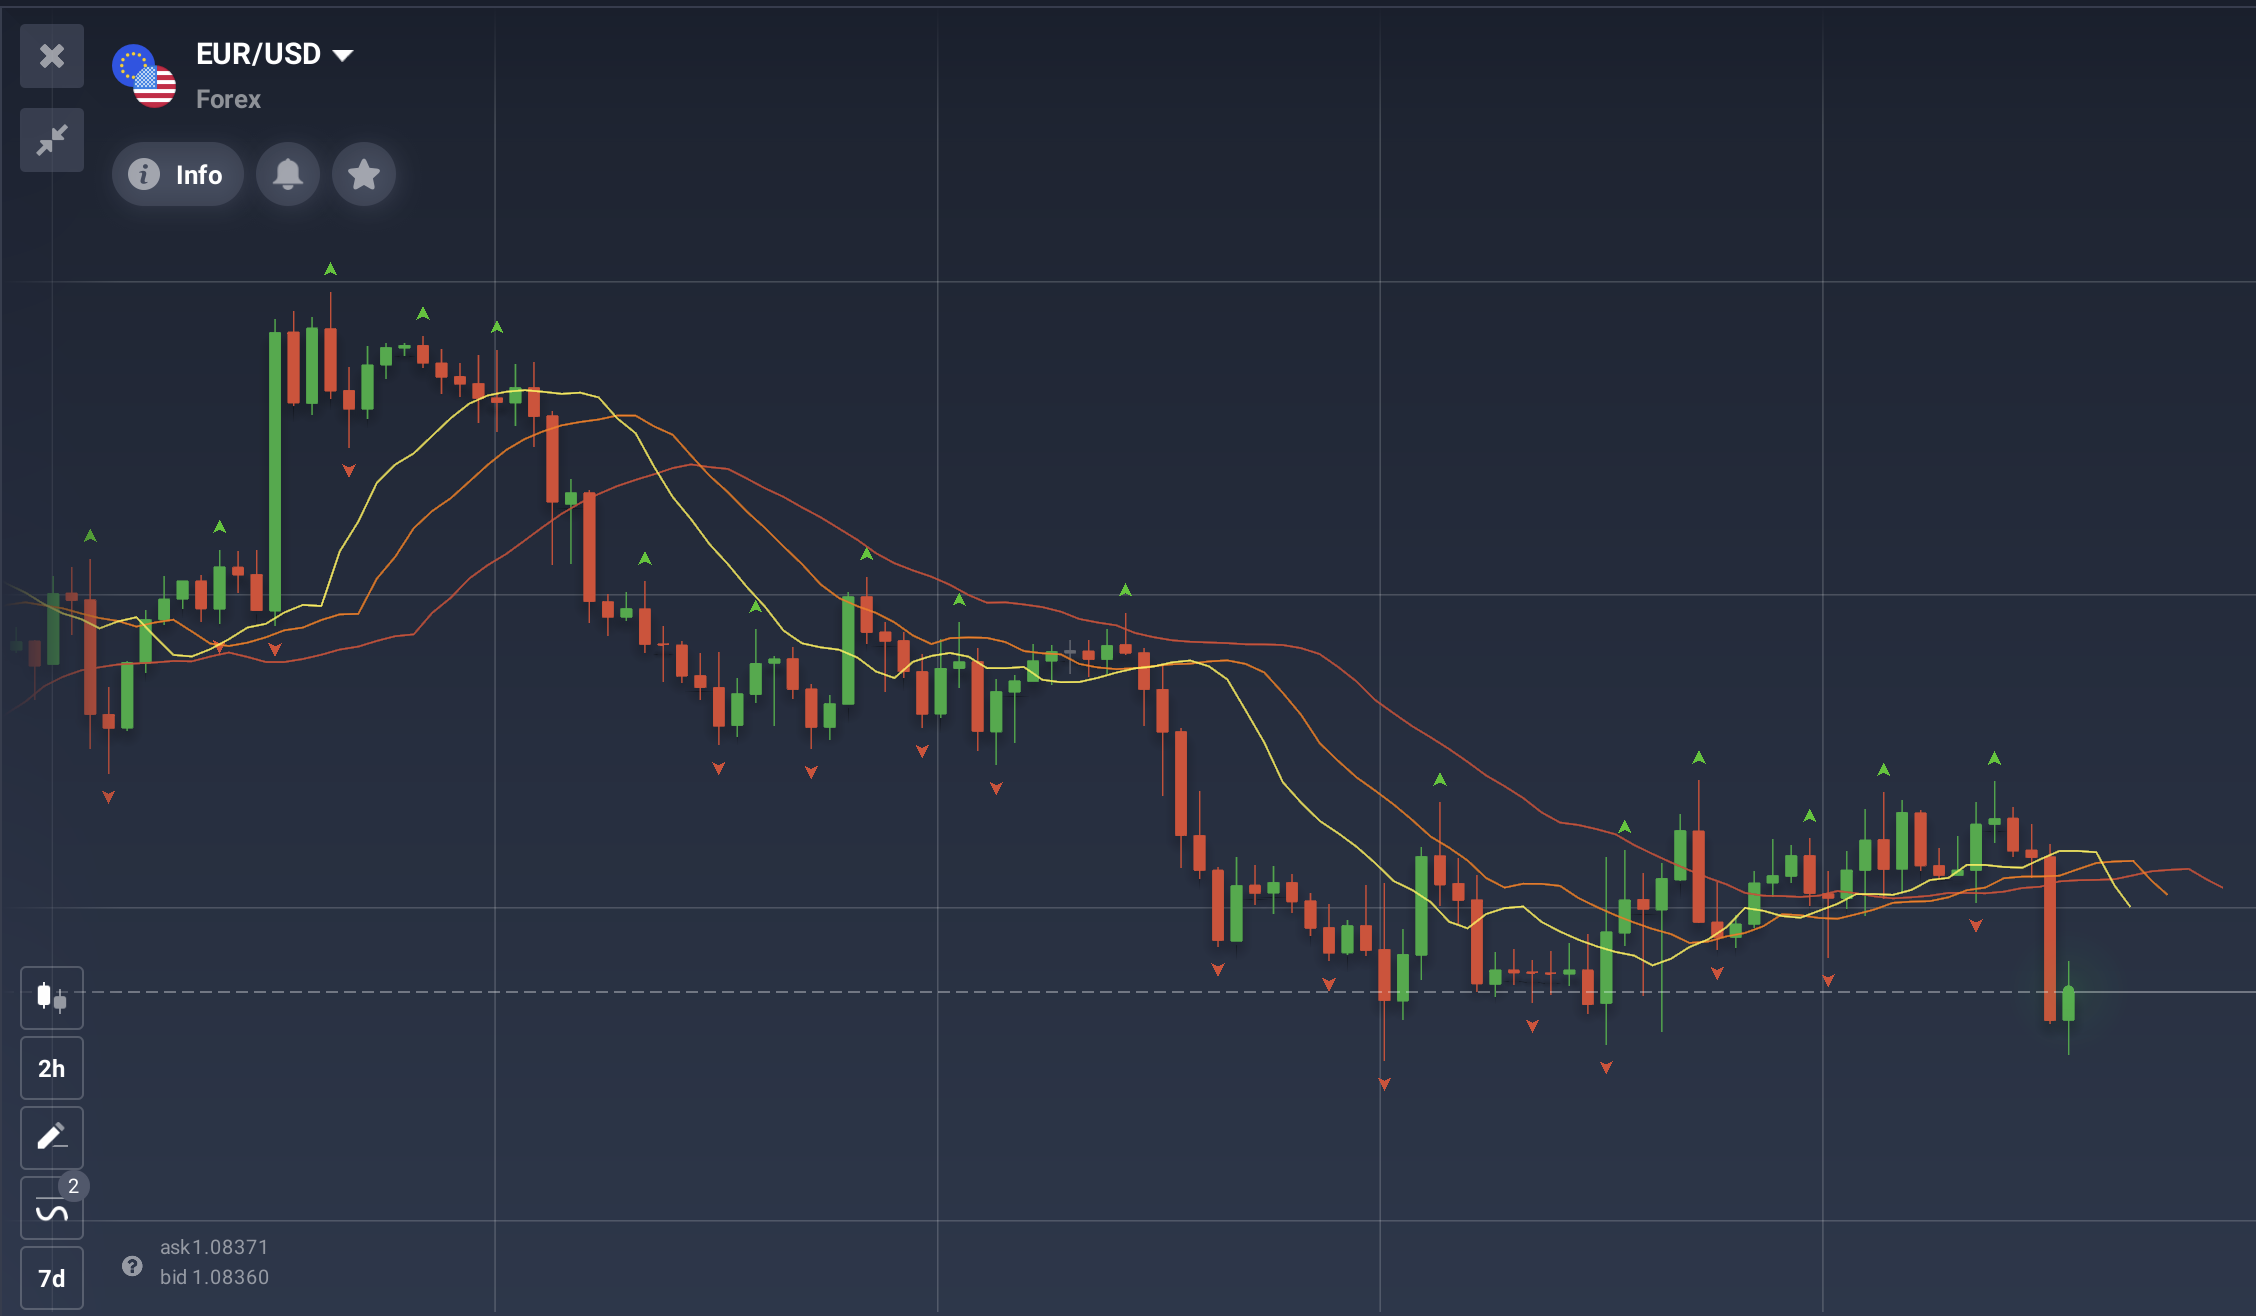
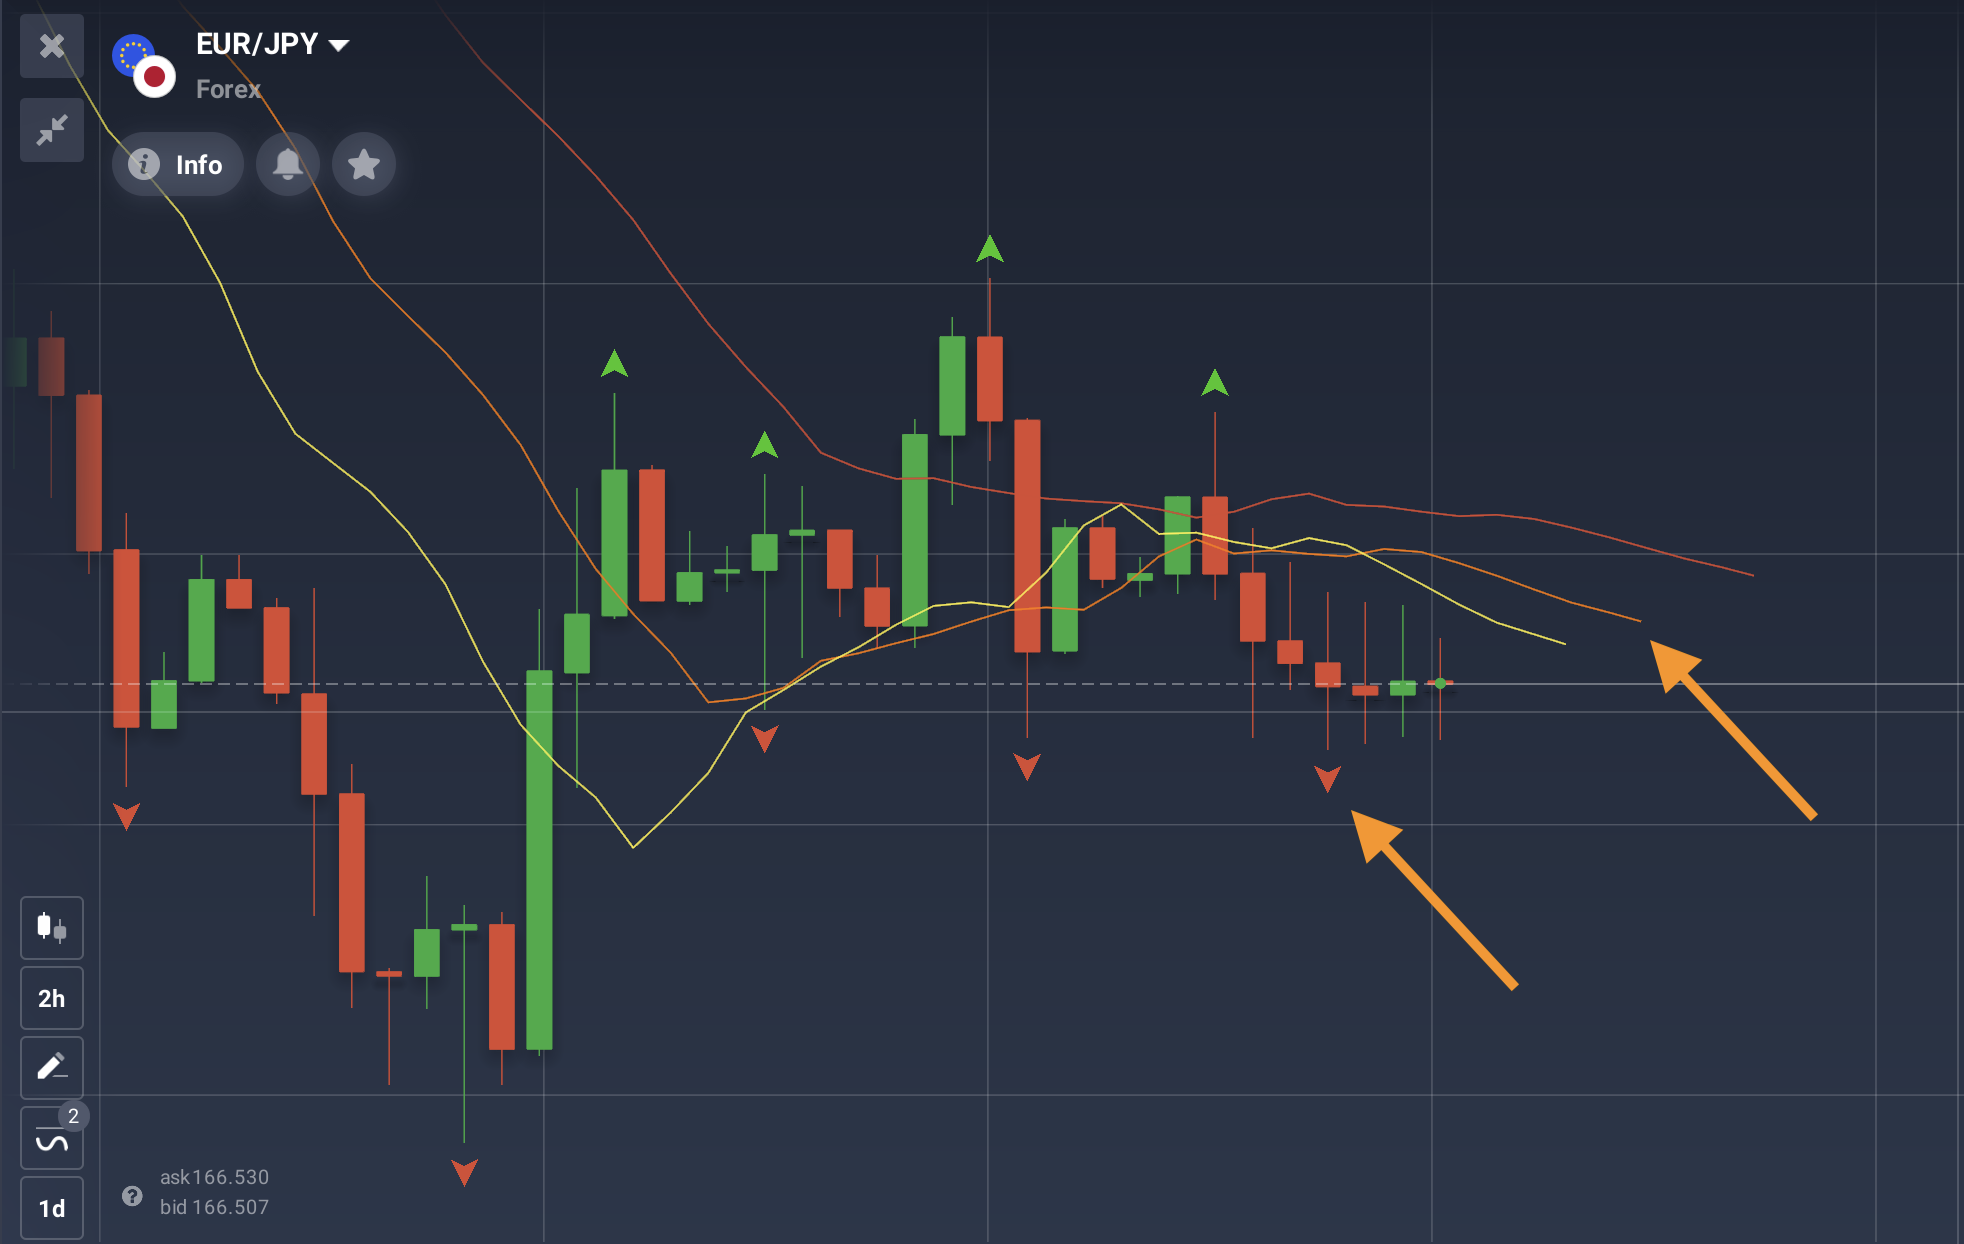
For example, have a look at this forex chart for the EUR/JPY currency pair. The latest Fractal arrow is red and is pointing down. This indicates a potential reversal to a bullish trend. As the arrow is located below the Alligator’s central line (orange), it might be considered a valid ‘Buy’ signal, suggesting a possible entry in the next few bars.
Things to consider
- Being trend following indicators, Alligator and Fractal strategy might be lagging a little bit behind the current market.
- It is possible to boost the accuracy of both indicators by increasing the period. The number of generated signals will, however, decrease.
- Signals should be checked on different timeframes for maximum predictive potential.
- The Alligator and the Fractals work best when used simultaneously. Using only one of the above signals can be risky.
- No indicator or trading system can provide accurate signals 100% of the time. So consider applying the appropriate risk-management tools available on the IQ Option platform. Here’s where you might want to start: 5 Risk Management Tools and Tips for Traders.