

The world of trading is full of surprises. For instance, have you heard of an indicator that looks like a rainbow? The Rainbow Moving Average indicator is an exciting new take on a simple Moving Average — one of the most basic technical analysis tools. Basically, it is up to 10 indicators in one, and could be even more if you wish so!
Why use 10 simple Moving Averages when you can use only one? The thing is, when several moving averages with different periods are applied, they can become an entire new indicator. The Rainbow can be used on any time frame and asset. Here is one more reason to use it: Rainbow MA looks absolutely stunning when overlaid on the price chart.
Ready to learn more? Let’s see how this tool works and how you can apply it on the price charts.
How does the Rainbow Moving Average indicator work?
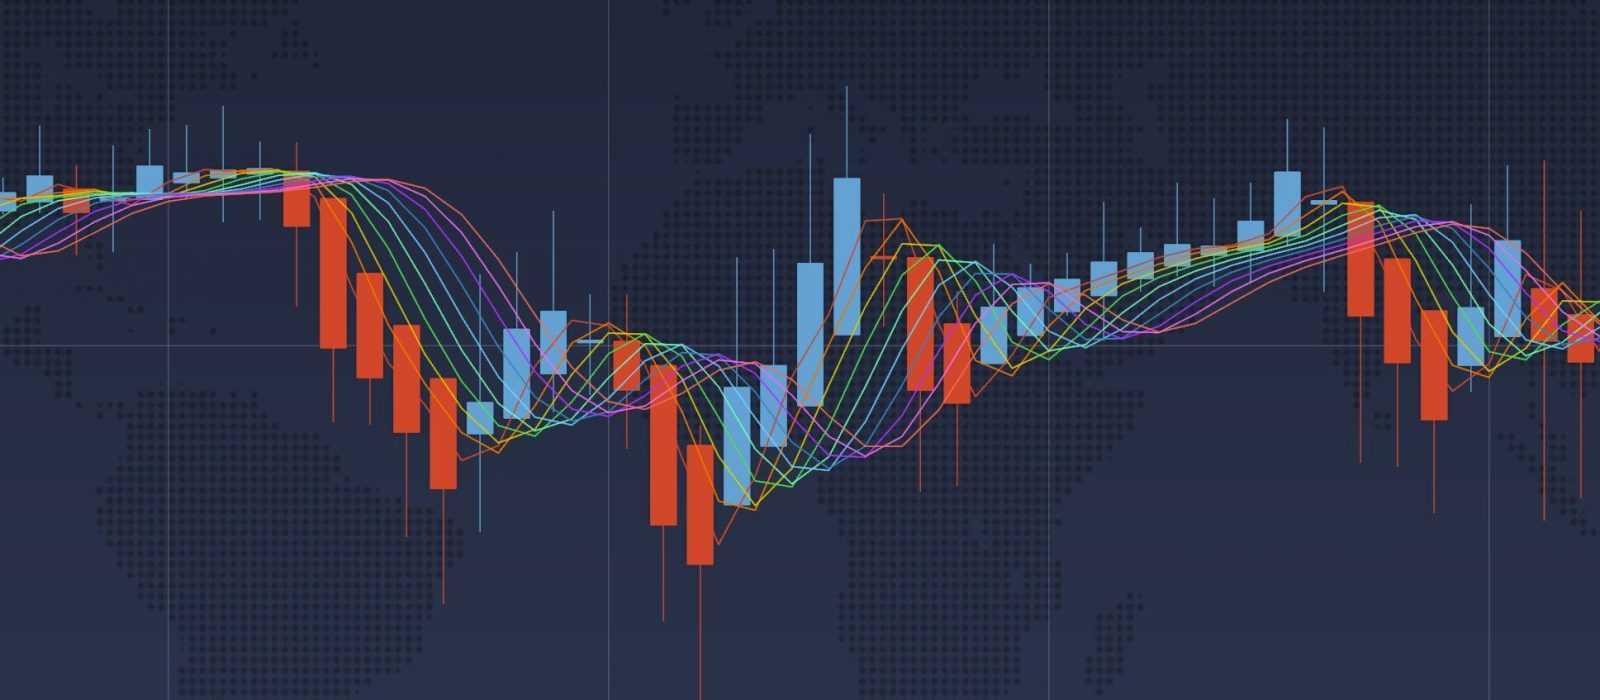
Any moving average is a trend-following tool. Rainbow MA is a combination of moving averages of different length that are all plotted on the same price chart. Their intersection, therefore, can hint at a price reversal and help estimate the trend strength. Note that the more lines you deploy, the longer it takes for the indicator to demonstrate a ‘complete reversal’ (an intersection of all moving averages).
There are several ways to use the Rainbow MA.
Using the Rainbow Moving Average on its own
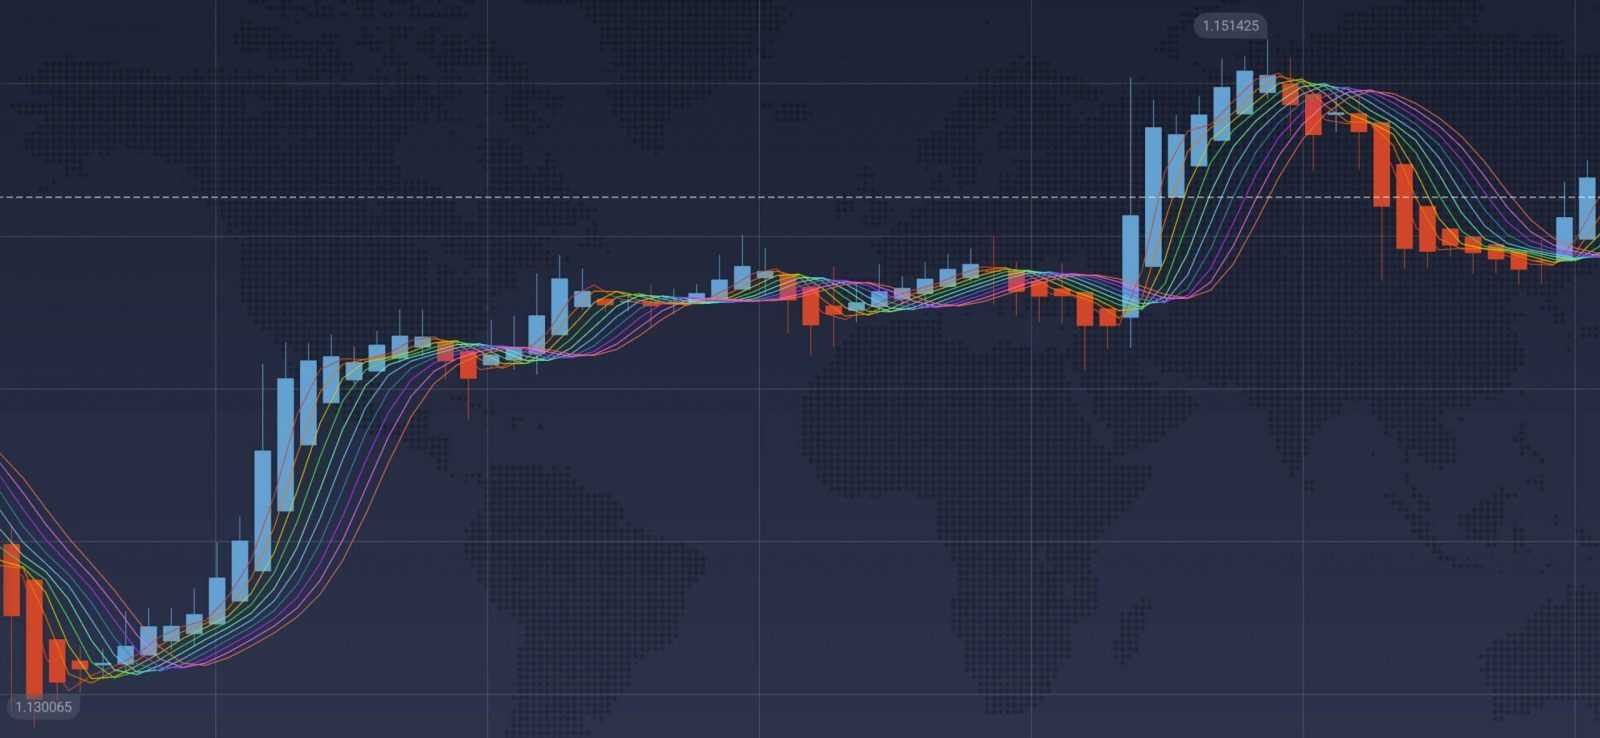
When applying this indicator on its own, pay attention to the shape created by the moving averages. It will hint at the trend strength. The steeper the curve, the stronger the trend. The flatter the curve, the weaker the trend.
☝️
Rainbow MA in combination with other tools
It can also be combined with other technical analysis tools as a trend-following indicator. In this case, when the trend is strong (as identified by Rainbow) and the indicator you use to determine entry points sends a bullish signal, traders consider opening a BUY position.
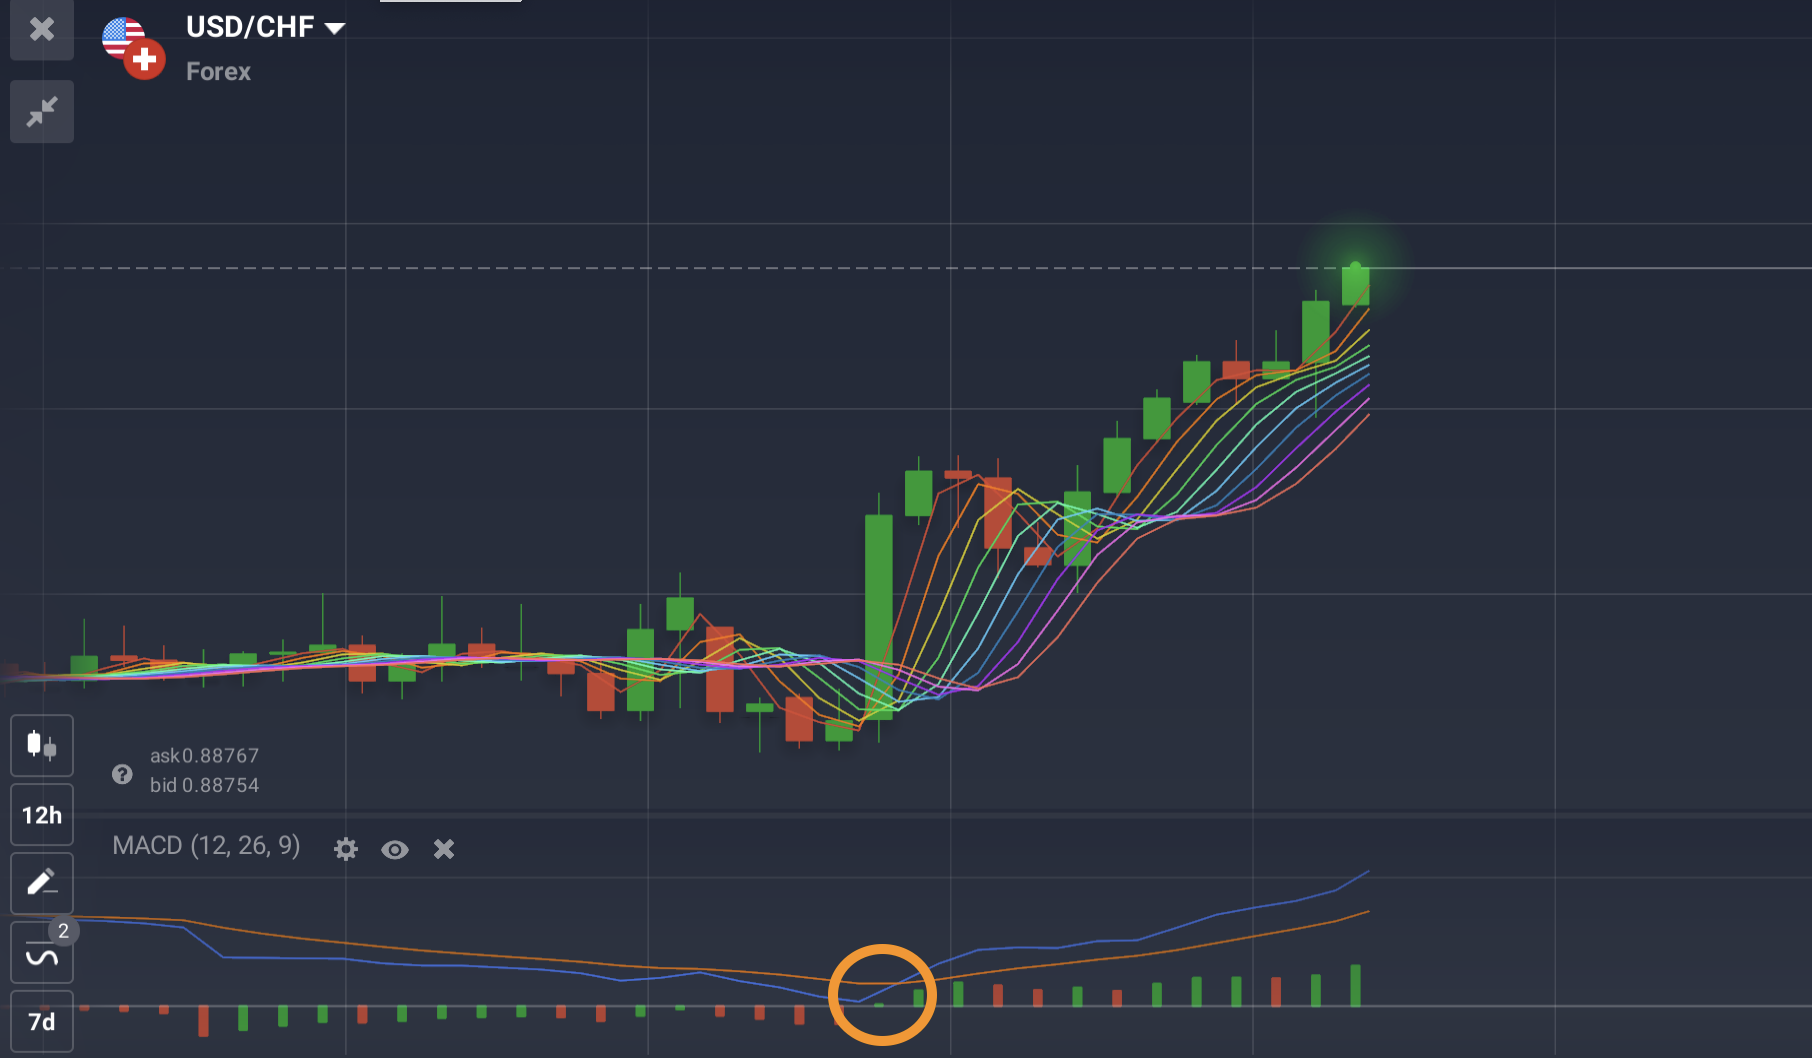
When the trend is strong (as identified by Rainbow) and the indicator you use to determine entry points sends a bearish signal, traders consider opening a SELL position. When the trend is weak, traders would generally abstain from opening new positions.
Rainbow Moving Average + retracement
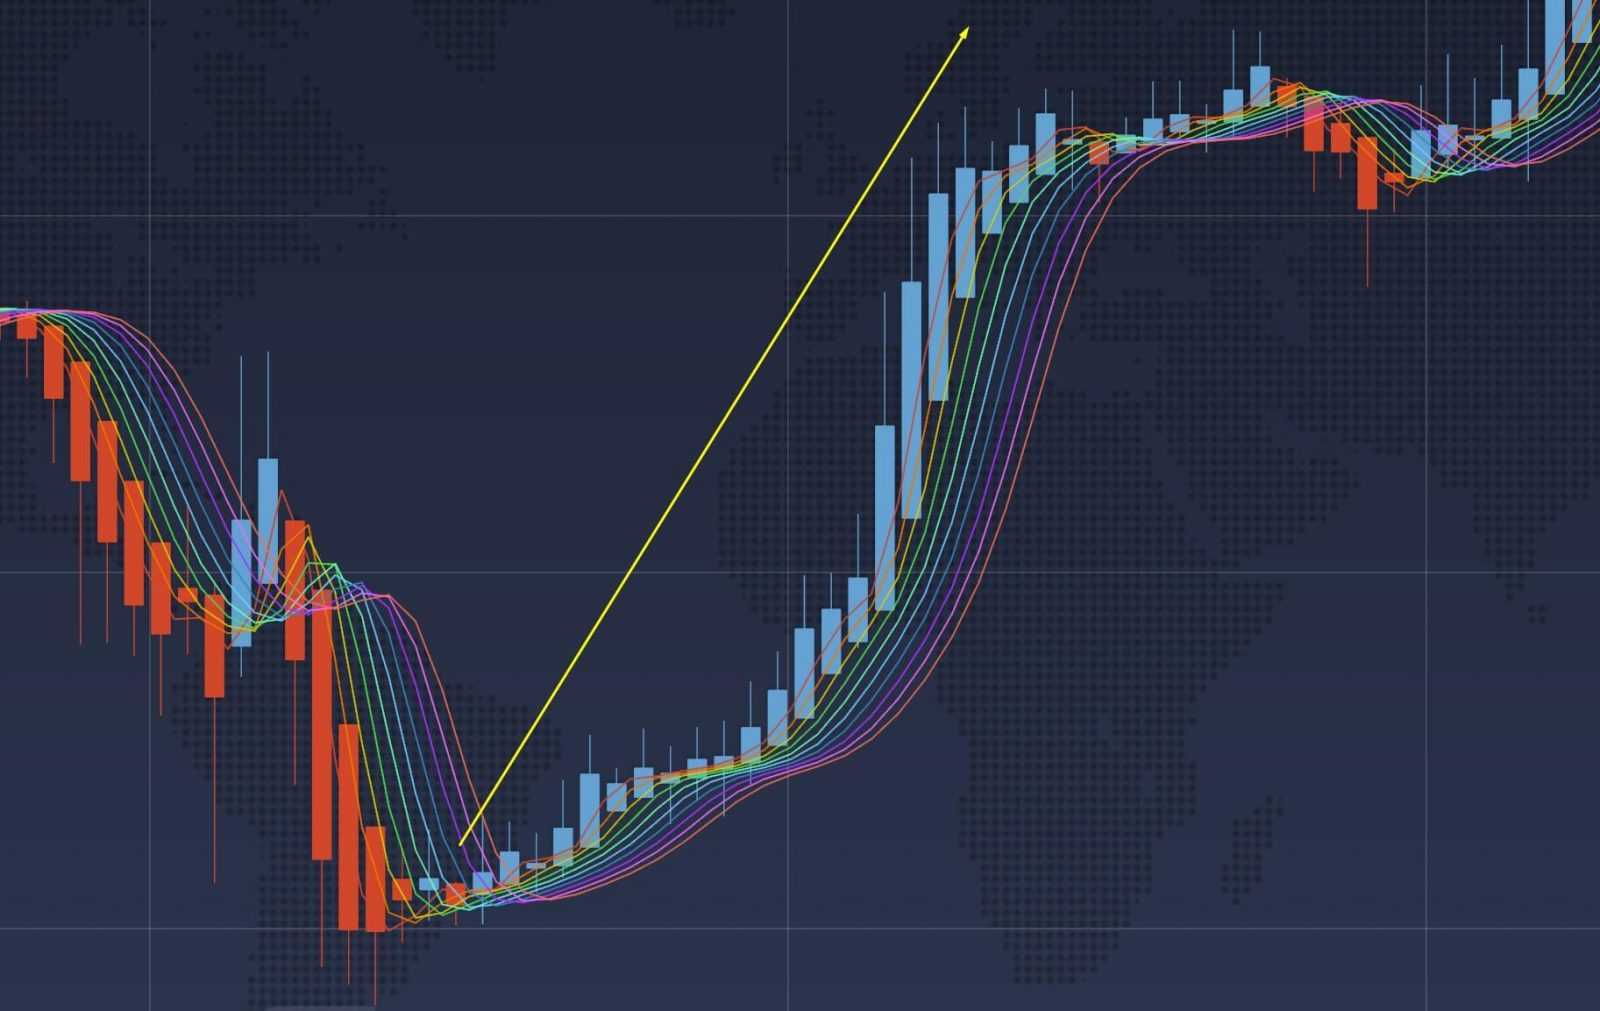
There is one more way to apply the Rainbow Moving Average indicator. During a strong trend, traders look for a short-term retracement. A retracement is a temporary change in the direction of an asset’s price, when it moves in the opposite direction from the main trend. For instance, in an uptrend, a retracement might occur when the asset price turns downward before returning to the direction of the main upward trend.
When traders notice a retracement, they may choose to enter a position in the direction of the general trend and against the retracement. It’s important to understand the difference between a retracement (a short-term slight change of price direction) from a major trend reversal. You can use different tools to assess the chart and identify potential reversals, such as the diamond chart patterns.
How to set up the Rainbow MA?
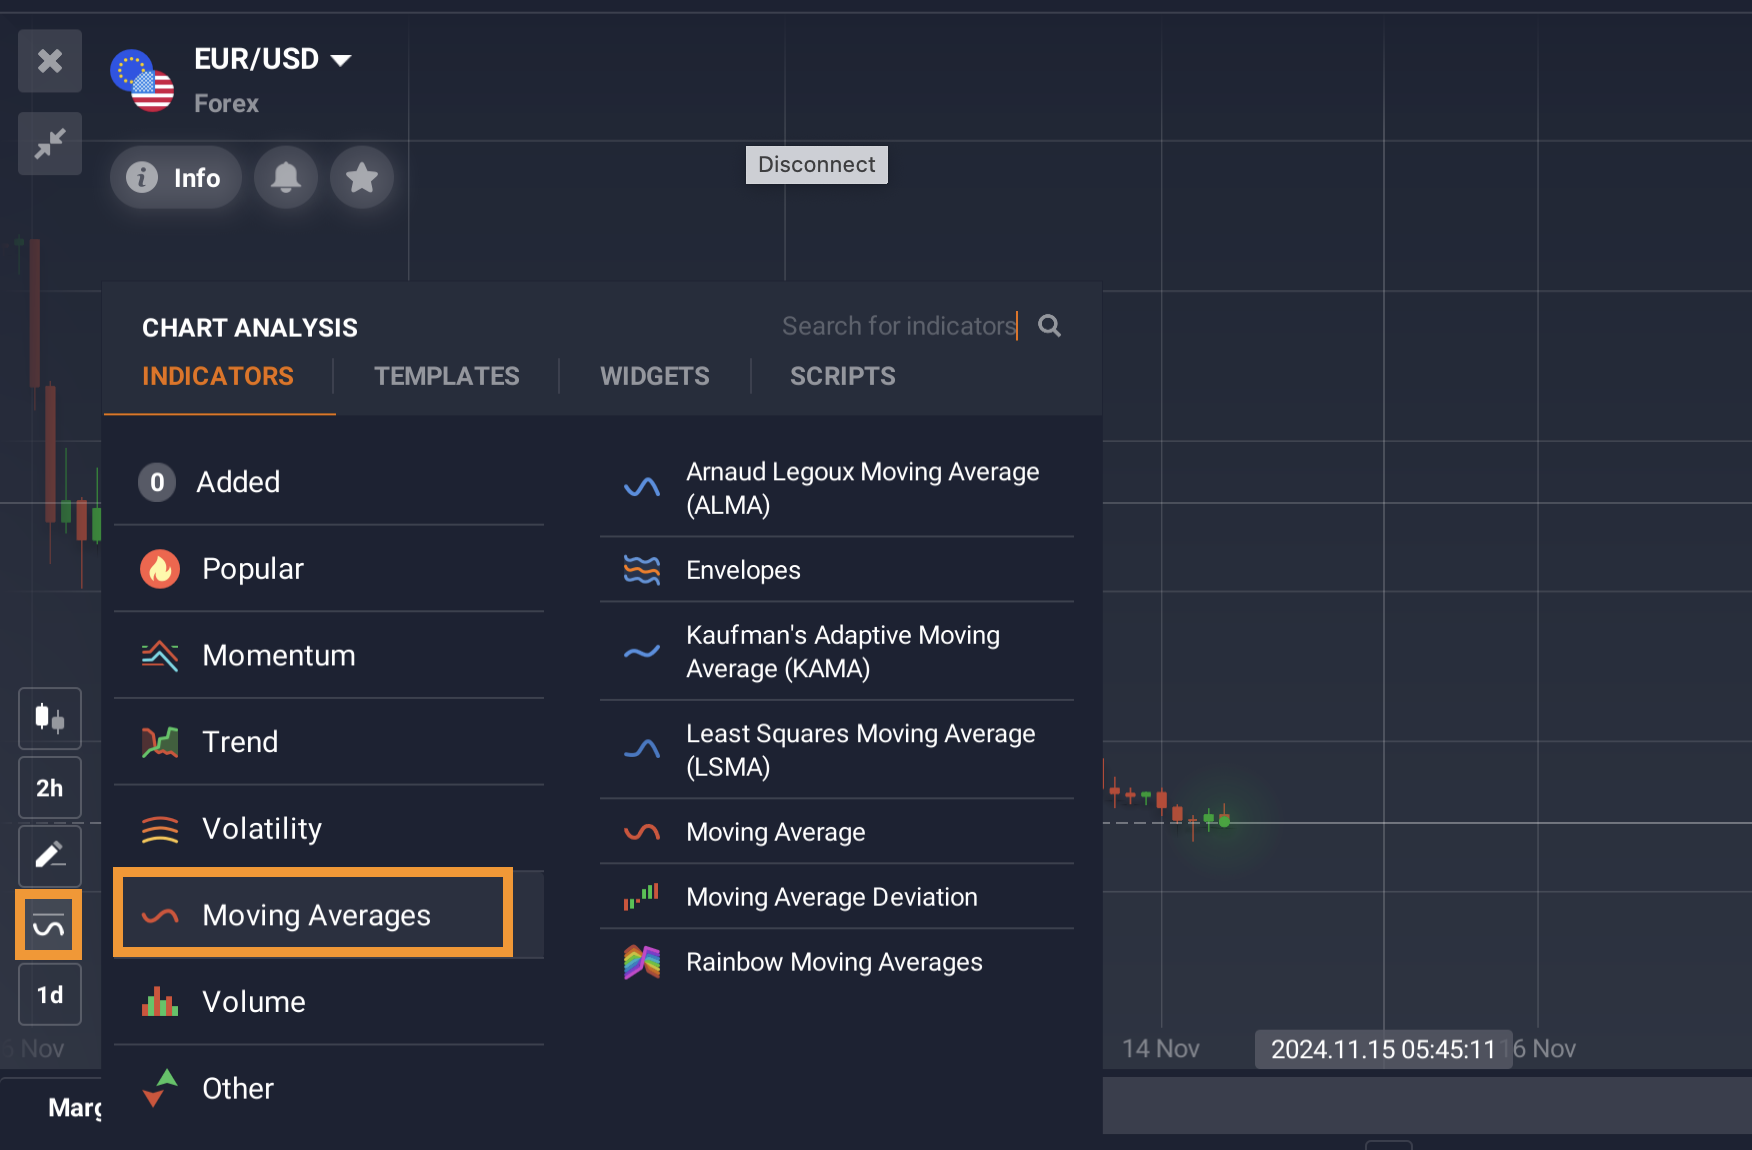
To set up and use the Rainbow Moving Average indicator, you would want first to go click on the ‘Indicators’ section in the bottom-left corner of the screen and then on the ‘Moving Averages’ tab.
In the set-up window, there are several options available. First is the number of periods that will be used for the purposes of calculation. By changing the number of periods, you can either increase the indicator’s sensitivity by bringing the number down or decrease the number of false alarms by increasing the number of periods.
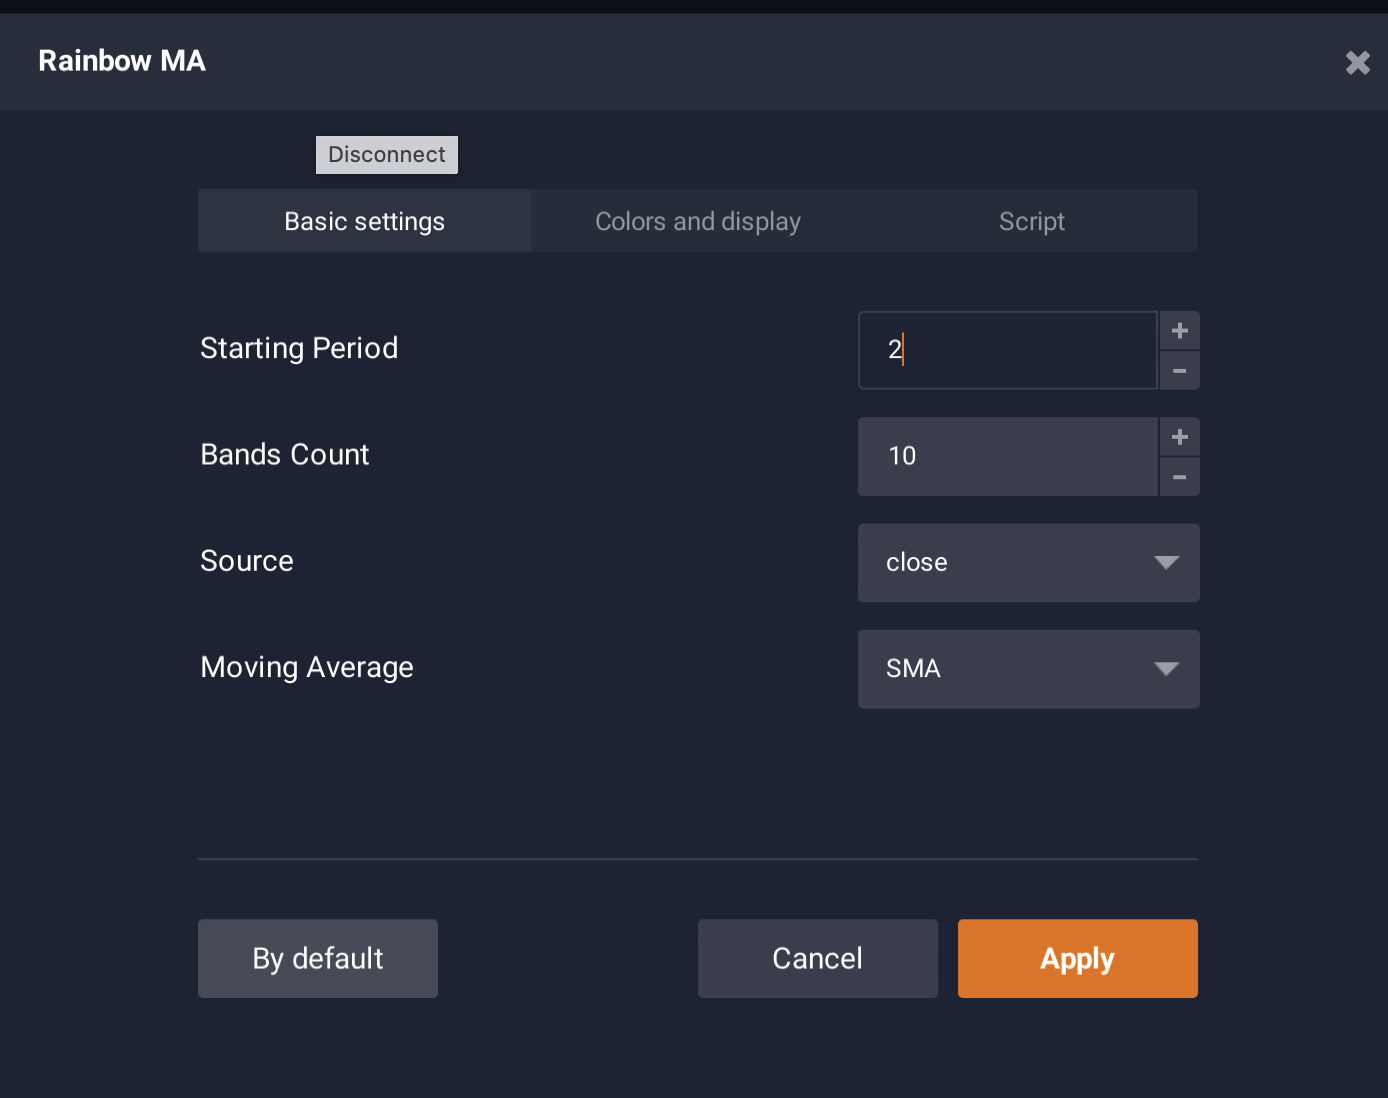
You can also choose the number of moving averages. It is important to find the right balance between the number of curves and ease of use. Most traders use 6 to 8. You can also choose the price type (open, close, high or low) and the moving average type that you will see. Close price and SMA — both are default parameters — are most commonly used.
Now, when you know how to set up and use Rainbow Moving Average in trading, you can proceed to the trading platform to give it a try and get first-hand experience! If you’d like to revise what you’ve learned in this article, have a look at this video explainer that goes over the main points.


