Homepage » Indicators
Parabolic SAR is a trend-following indicator that plots a calculated trailing level above or below price. What you see What...
The Average Directional Index, or ADX, measures trend strength. It does not tell you whether price is going up or...
The Stochastic Oscillator is a momentum indicator that shows where the latest closing price sits inside a recent high-low range....
Average True Range, or ATR, measures how much an asset has been moving. It does not measure direction. A rising...
Bollinger Bands are a volatility indicator plotted around price. The standard version uses a 20-period simple moving average as the...
MACD is a trend and momentum indicator built from moving averages. Its full name is Moving Average Convergence Divergence. The...
RSI, or the Relative Strength Index, is a momentum indicator. It compares the strength of recent price gains with recent...
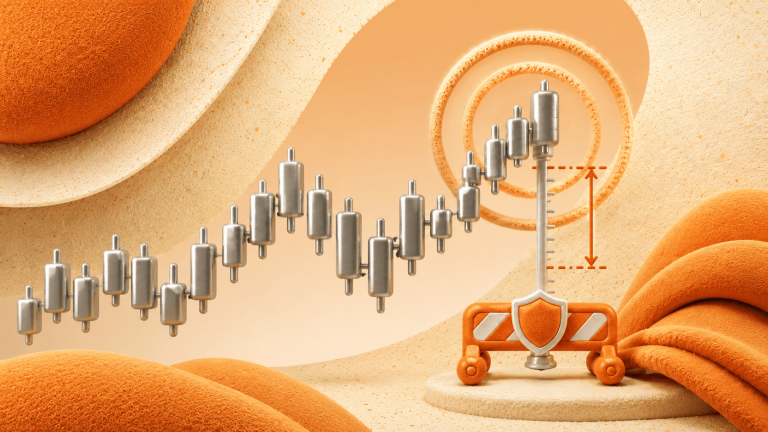
An ATR stop starts with one calculation: Stop distance = ATR x multiplier If the entry is 100, ATR is...