Psychological Line Indicator (PSY) is an oscillator-type indicator that compares the number of the rising periods to the total number of periods. In other words, it indicates the percentage of bars that close above the previous bar over the course of a given time period. This information can help traders understand the overall market trend — bullish or bearish — and identify overbought and oversold levels. Keep reading to learn how to trade with the Psychological Line Indicator and get more accurate trading signals using technical analysis.
How does the Psychological Line Indicator work?
The Psychological Line Indicator is easy to set up and operate. The main indicator line fluctuates between 0 and 100. This indicator can be used for trading on any timeframe (daily, weekly, monthly) and any asset.
☝️
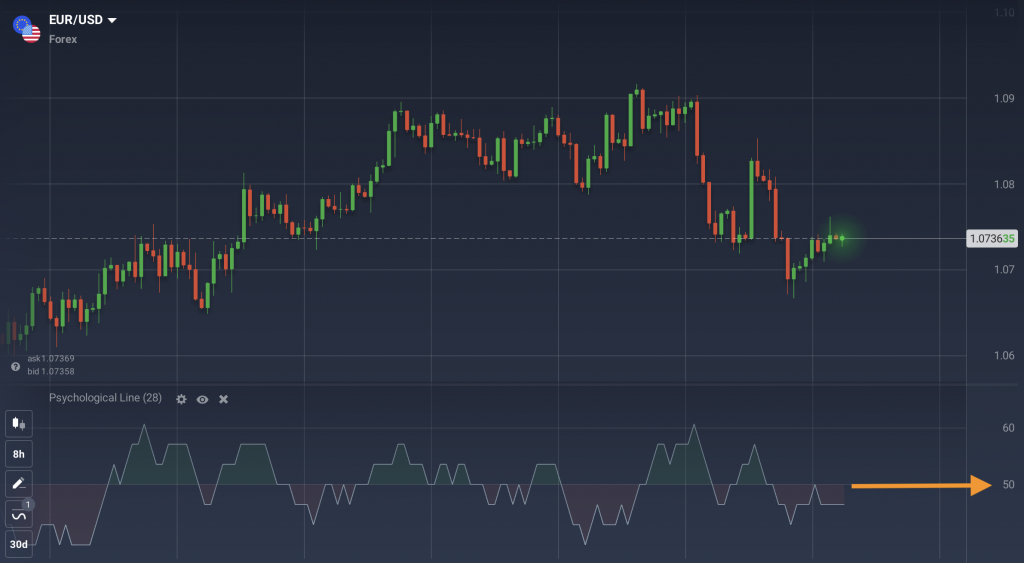
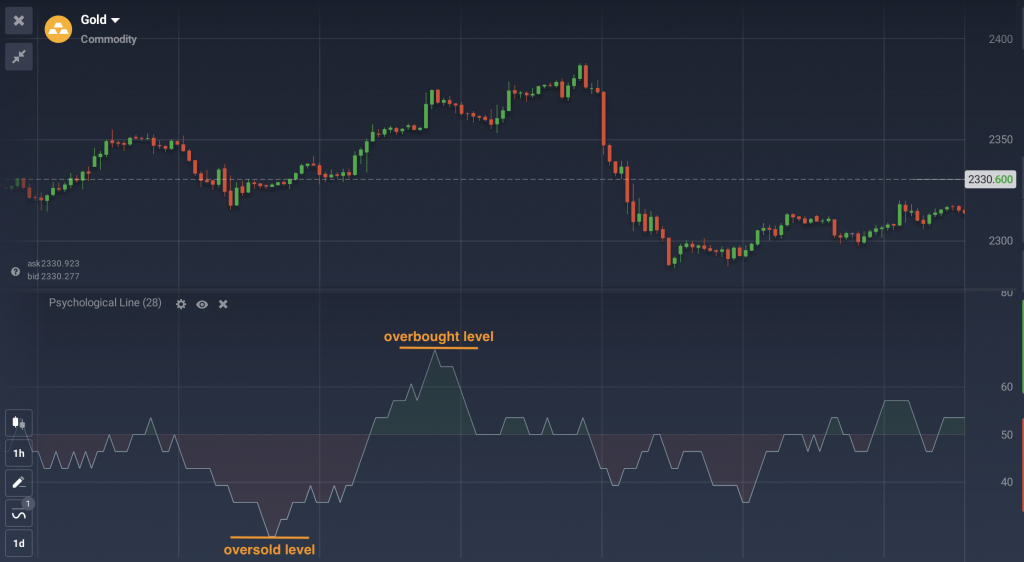
Like most other oscillators, PSY can also point to the overbought and oversold levels. When its indicator line moves above 70, the asset is considered to be overbought. When the indicator line is below 30, the asset at hand is considered to be oversold.

The higher the indicator line, the stronger the positive trend. Conversely, the lower the indicator line, the stronger the negative trend. Using the readings of this indicator, you can get a better understanding of the market conditions and make quick trading decisions.
How to trade the PSY indicator?
Like any other indicator, Psychological Line is used either to provide trading signals of its own or to confirm signals received from other indicators. Even when PSY acts as your primary indicator, it may be a good idea to confirm its readings by indicators of other types.
There are a few main ways you can trade with the Psychological Line Indicator.
Trading with the trend
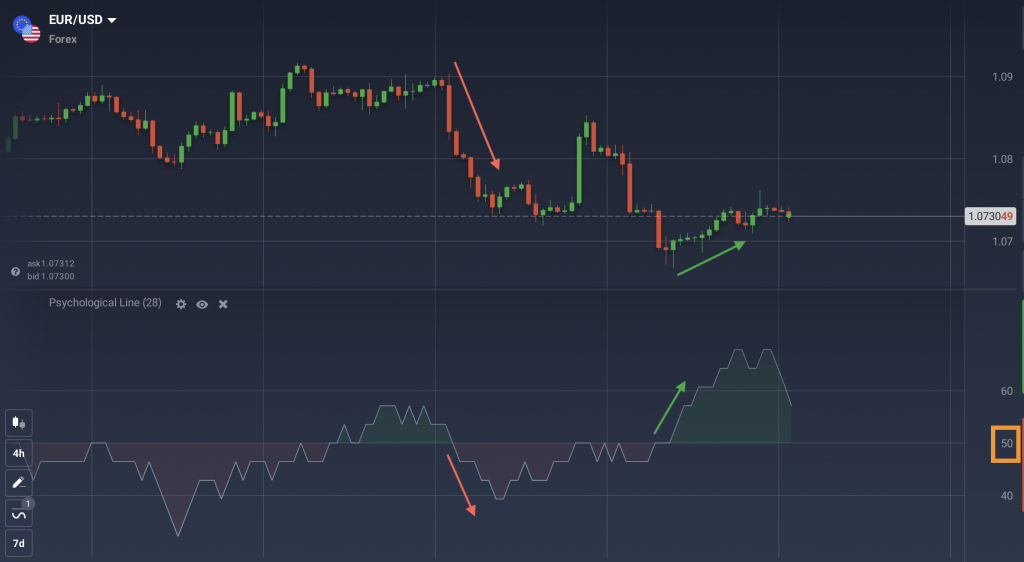
For those of you trading with the trend, opening a BUY deal when the indicator is in the green zone (above 50) and a SELL deal when the indicator is in the red zone (below 50) is the most commonly used strategy.
Trading trend reversals
Overbought and oversold levels (70 and 30 respectively) can also be used in trading. When the price crosses the 70 line from below, the asset is overbought. Since the asset cannot stay in the overbought position forever, it will have to leave it eventually. A new negative trend can, therefore, be expected.
The same applies to the asset that stays in the oversold position for too long. Sooner or later, the price will have to go back up. One thing Psychological Line cannot do is to predict the exact moment when the reversal is expected. You will have to pinpoint it by yourself by using other indicators and your experience.
Divergence
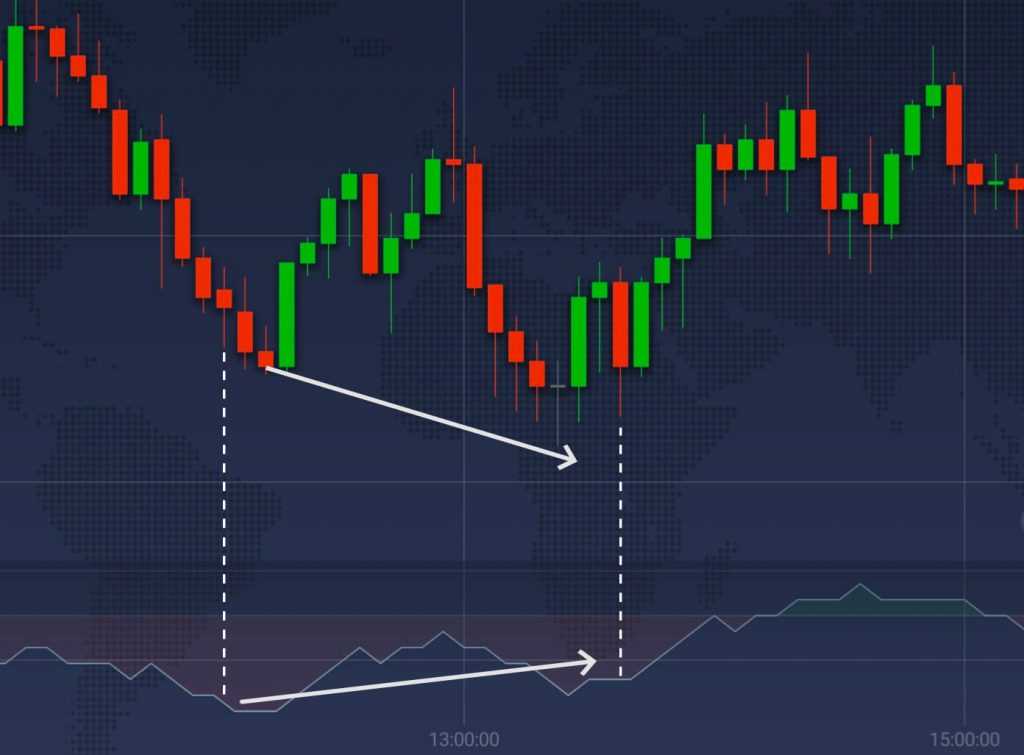
There is one more signal type this indicator is capable of sending. Like any other oscillator, when PSY moves in one direction and the asset price does the opposite, a divergence is observed. The latter is often associated with an upcoming trend reversal.
No matter how you use it, remember that Psychological Line, as any other indicator, cannot be accurate 100% of the time and will sometimes provide false signals. Make sure you’re using the appropriate risk-management tools to understand risks and protect your capital.
The Psychological Line indicator set up
Setting up the Psychological Line indicator is easy. Go to the ‘Indicators’ by clicking the corresponding button in the bottom left-hand corner of the screen.
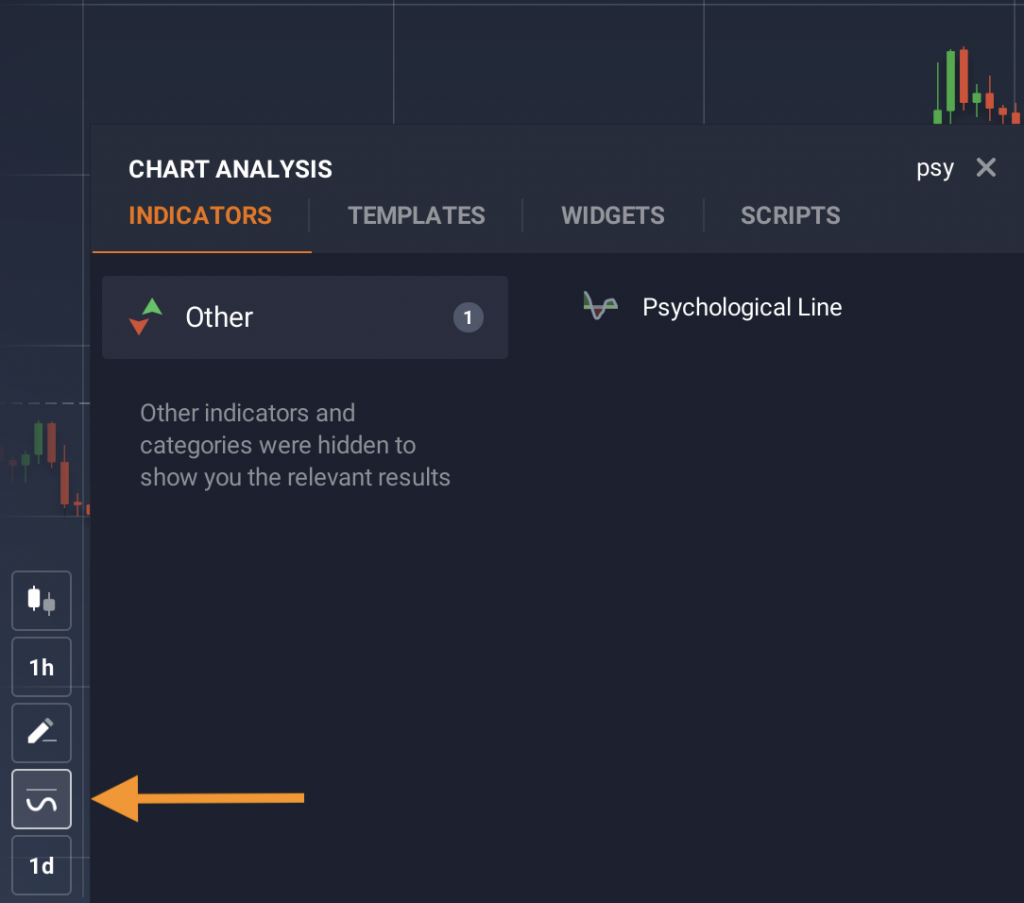
Then click on the ‘Other’ tab and choose Psychological Line from the list of available indicators, or use the search. Click ‘Apply’ without changing the default settings.
Later on, you can adjust the number of periods offered in the indicator settings. Keep in mind that the higher the period, the less sensitive PSY will be. If you lower the period, the indicator will become more sensitive. But remember that the number of false signals might also go up.
The indicator is ready to use!
Now, when you know how to set up the Psychological Line Indicator, you can go to the IQ Option platform and give it a try. Chances are, it will become an integral part of your trading strategy. Even if it doesn’t, you will get a chance to test a new tool and expand your technical analysis skills. Good luck!
