
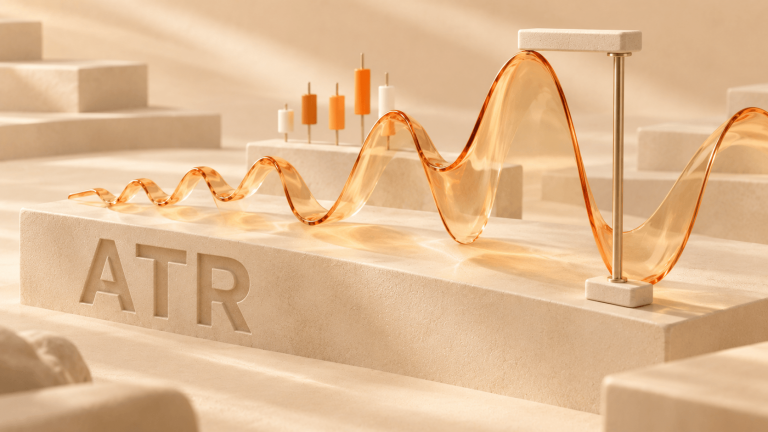
Average True Range, or ATR, measures how much an asset has been moving. It does not measure direction.
A rising ATR means recent candles and gaps are getting larger. A falling ATR means movement is becoming smaller. The standard setting is 14 periods.
ATR is expressed in the same units as price. If a stock has a 14-day ATR of 3.20, its true range has averaged about $3.20 over the calculation. That does not mean it will move $3.20 tomorrow.
This is how I read the basic picture:
| ATR reading | What it means |
|---|---|
| ATR rising | Recent price ranges are expanding. Volatility is increasing. |
| ATR falling | Recent ranges are contracting. Volatility is decreasing. |
| High ATR | Movement is large relative to this market’s recent history. |
| Low ATR | Movement is small relative to recent history. |
| Price rising with ATR rising | A larger upward move is underway. ATR still does not confirm that it will continue. |
| Price falling with ATR rising | A larger downward move is underway. The same ATR behavior can occur in either direction. |
Why ATR uses true range instead of candle range
The range of one candle is simply its high minus its low. That misses any gap between the previous close and the next session.
True Range checks three distances and keeps the largest:
1. Current high - current low

2. Absolute value of current high - previous close

3. Absolute value of current low - previous close
This matters whenever price opens far from where the previous candle closed.
META closed at 323.00 on February 2, 2022. The following session traded between 235.75 and 248.00.
The candle itself was only 12.25 points high to low. But the distance from the previous close to the new low was 87.25 points. True Range used 87.25 because that was the movement a high-low calculation would have missed.
I find this example more useful than memorizing the formula. ATR includes gaps because risk does not begin at the next opening price. A position carried from the previous close experiences the gap too.
How Average True Range is calculated
True Range measures one candle. ATR smooths those readings over several candles.
J. Welles Wilder's standard calculation starts with the average of the first 14 True Range values. Later values use Wilder's smoothing:
ATR today = ((Previous ATR x 13) + Current True Range) / 14The newest True Range therefore changes ATR gradually. One large candle raises the line, but it remains part of the calculation as later candles arrive.
Some platforms offer other smoothing methods. That can produce slightly different values. When comparing charts, I check the period and smoothing method before assuming the data is wrong.
ATR measures movement, not direction
ATR is always positive. A 10-point rally and a 10-point decline can produce similar True Range values.
This sounds obvious, but it changes how the indicator should be used. I do not read a rising ATR as bullish or a falling ATR as bearish.
Instead, I ask a narrower question: is the market moving more or less than it was before?
Price structure answers the directional question. ATR helps estimate the scale of that movement.
Raw ATR and ATR percentage are not the same thing
Raw ATR is useful for one instrument because it uses the same units as orders and price levels. It is poor for comparing assets with different prices.
An ATR of 10 is enormous for a stock trading at 25 and small for an index trading above 5,000.
ATR percentage solves that problem:
ATR% = ATR / Closing price x 100ATR% makes market volatility easier to compare across assets and across price levels.
SPY had a 14-day ATR of 2.90 on February 19, 2020. That was 0.86% of its closing price. By March 23, ATR had risen to 14.73, or 6.61% of the close.
ATR% increased about 7.7 times. A fixed five-point distance meant something completely different in those two environments.
I use raw ATR when planning levels on one chart. I use ATR% when comparing volatility across time or across instruments.
How traders use ATR for stop placement
A fixed stop ignores current movement. A one-point stop may be wide in a quiet market and very tight in a fast one.
An ATR-based rule adapts the distance:
Long stop distance = ATR x chosen multiple

Short stop distance = ATR x chosen multiple
If ATR is 1.20 and the rule uses 1.5 ATR, the distance is 1.80.
The multiple is not a universal setting. A 1 ATR stop may suit one tested setup and sit inside ordinary noise for another. Timeframe, holding period, entry logic and market structure all matter.
I also avoid placing the stop from ATR alone. A price level should explain why the trade is wrong. ATR can then show whether that level is unusually close or far relative to current movement.
How ATR connects stop distance and position size
Wider stops need smaller size if the maximum planned loss stays constant.
Suppose I am sizing a stock position where a $1 price move changes profit or loss by $1 per share. I cap the planned loss at $100 before costs:
ATR = 1.20
Stop multiple = 1.5
Stop distance = 1.80

Position size = 100 / 1.80
Position size = 55 shares after rounding down
If ATR doubles while the risk budget stays at $100, the position size needs to fall. Keeping the same size would double the planned price risk.
For CFDs, forex, futures and other contract-based instruments, I also include the point, pip or tick value and any contract multiplier:
Position size = Risk budget / (Stop distance x value per price unit)The instrument specification determines that value. Dividing dollars by ATR alone is not enough when one price unit does not equal $1 of profit or loss per unit held.
This calculation is a planning tool, not a guarantee. Slippage, fees and gaps can make the actual exit different from the stop price.
Can ATR set a profit target?
ATR can put a target into context. If an asset has been moving 1.5% per day, a same-day target 8% away requires an unusual move.
But ATR does not provide the probability of reaching that target. It also does not identify support, resistance or direction.
I use it to check whether the expected move is plausible relative to recent movement. Price structure still decides where the target belongs.
ATR settings and timeframes
The standard period is 14, but the number counts candles rather than days.
- 14 on a daily chart: 14 daily candles.
- 14 on a one-hour chart: 14 hourly candles.
- 14 on a five-minute chart: 14 five-minute candles.
A shorter period reacts faster to new ranges and gaps. It also changes more sharply after one unusual candle. A longer period is smoother and slower.
I start with 14 because it is the shared reference. I change it only when the complete rule is tested on the intended instrument and timeframe.
Common ATR mistakes
Treating high ATR as a buy or sell signal
High ATR means large movement. It does not say which side is stronger.
Comparing raw ATR across different assets
Price units are not comparable. Use ATR% when the assets or price levels differ.
Assuming low ATR predicts a breakout
Low ATR shows quiet conditions. It does not guarantee a breakout or identify its direction.
Using the same ATR multiple everywhere
The multiple only has meaning inside a complete rule. A number copied from another market may not fit the current setup.
Moving a stop farther after entry
Recalculating ATR can be part of a trailing-stop rule defined before entry. Using a higher ATR to loosen an existing stop changes the original risk after the trade is open.
My ATR checklist
- Question: am I measuring volatility, setting a distance or sizing a position?
- Units: do I need raw ATR or ATR%?
- Period: what does 14 represent on this timeframe?
- Regime: is ATR rising, falling or stable relative to its own history?
- Structure: which price level invalidates the idea?
- Distance: how many ATRs away is that level?
- Size: does the position still fit the planned loss after costs?