

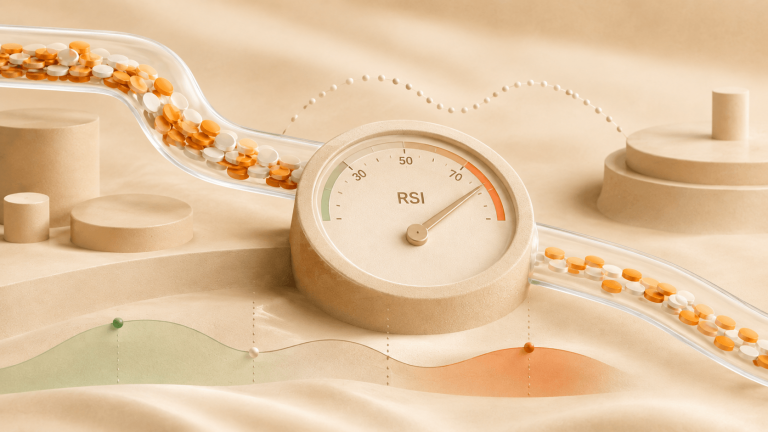
RSI, or the Relative Strength Index, is a momentum indicator. It compares the strength of recent price gains with recent losses and plots the result on a scale from 0 to 100.
On most charts:
- Above 70 is called overbought.
- Below 30 is called oversold.
- Around 50 means recent gains and losses are closer to balance.
These levels describe what price has been doing. They do not predict the next candle. I use RSI to judge momentum, then look at price to decide whether that momentum is continuing or starting to fail.
Imagine a daily chart in a clear uptrend. Price has broken above a previous high, and RSI(14) has just moved above 70.
Then price makes another higher high after a shallow pause. RSI dips toward 60, then climbs above 70 again. The first reading did not say “sell.” It showed strong momentum inside an uptrend.
The point is not that buying above 70 always works. It is that overbought does not mean the top is in.
This is how I read the main RSI signals:
- Above 70: upward momentum has been strong. I check whether price is trending or rejecting a known level.
- Below 30: downward momentum has been strong. I check whether price is stabilizing or still making lower lows.
- Around 50: recent gains and losses are closer to balance.
- Divergence: momentum changed relative to price. I still need a price trigger.
RSI describes the move already on the chart. It does not choose the trade.
How RSI works
The Relative Strength Index is a momentum oscillator developed by J. Welles Wilder Jr. It compares recent upward and downward price changes and converts the result into a number from 0 to 100.
RSI rises when gains dominate the selected period. It falls when losses dominate.
Despite the name, the indicator isn’t comparing EUR/USD with GBP/USD or one stock with an index. It measures the internal momentum of one price series.
The common setting is 14 periods. On a daily chart, RSI uses daily changes. On a 15-minute chart, it uses changes between 15-minute closes. The setting may still say 14, but the market window is completely different.
What RSI 70, 50 and 30 mean
RSI above 70
An RSI above 70 means recent gains have been much stronger than recent losses. Traders call this overbought.
I consider a reversal only when price also gives me a reason: rejection at resistance, a failed breakout, a close back inside a range or a break of a recent swing low. Without that evidence, 70 is a momentum reading.
RSI below 30
Below 30 is called oversold. It doesn’t mean the asset is cheap or that buyers must arrive on the next candle.
During a breakdown or a news-driven move, RSI can remain below 30 while price continues falling. I want to see price stop making lower lows before treating the reading as part of a reversal setup.
The 50 line
The centerline is useful as a rough momentum filter:
- RSI holding above 50 supports positive momentum.
- RSI holding below 50 supports negative momentum.
- Repeated crossings around 50 suggest mixed conditions.
One cross is not an entry. The line matters more when it agrees with the price structure.
Why RSI can stay overbought in a strong trend
In the chart above, RSI crosses 70 only after price has already established higher highs and higher lows. It reaches 80, eases toward 60 during a mild pullback, then moves above 70 again as price makes a new high.
I would not buy simply because RSI crossed 70. I would use the reading to avoid an unsupported short against the trend.
For a continuation setup, I want to see:
- Higher highs and higher lows on price.
- RSI spending more time above 50 than below it.
- A pullback that holds above a previous breakout area or swing low.
- A clear level that invalidates the idea.
The indicator answers one question: is recent momentum still strong? Price still has to answer where the trade is wrong.
When RSI extremes matter more in a range
RSI extremes become more useful to me when price is moving between established boundaries.
Suppose a market has repeatedly held between 98 support and 104 resistance. Price trades above 104 during the day, RSI reaches 74, but the candle closes back inside the range at 103.70.
I would define the idea before entering:
- Context: price rejected a tested range boundary.
- Confirmation: RSI turned down and crossed back below 70.
- Invalidation: price closes back above the rejection high.
- First area to review: the middle of the range, not automatically the opposite boundary.
If price closes above 104 and holds there, I no longer have a range reversal. RSI doesn’t overrule the breakout. The support and resistance guide explains how I mark these boundaries before the indicator reaches an extreme.
A bearish RSI divergence example
Bearish RSI divergence appears when price makes a higher high while RSI makes a lower high. Bullish divergence is the opposite: price makes a lower low while RSI makes a higher low.
Suppose price rises from 100 to 111. RSI reaches 81 at the first high but only 69 when price makes the second, higher high. That is bearish divergence.
The divergence warns that the second rise had weaker momentum. It does not identify a short entry by itself.
I would wait for price confirmation. A close below the most recent pullback low can turn the visual warning into a condition I can test. The invalidation can then sit above the latest high, rather than somewhere inside normal daily movement.
And if price closes above the latest high, the divergence has failed. A proper test has to include those failed signals, not just the clean ones.
RSI settings: 14, 70 and 30
| Setting | Starting point | What changes |
|---|---|---|
| Period | 14 | A shorter period reacts faster and produces more extreme readings. A longer period is smoother. |
| Price source | Close | A different source changes every gain and loss used in the calculation. |
| Overbought | 70 | Raising the level to 80 creates fewer overbought readings. |
| Oversold | 30 | Lowering the level to 20 creates fewer oversold readings. |
I start with 14, 70 and 30 because they provide a common reference. They are not optimized settings.
A faster RSI is not automatically better for day trading. It reacts sooner because it also reacts to more noise. I change a setting only when I can test a fixed entry, exit and invalidation rule on unseen data.
How RSI is calculated
The formula is:
RS = Smoothed average gain / Smoothed average loss

RSI = 100 - [100 / (1 + RS)]
If the average gain is three times the average loss, RS equals 3 and RSI equals 75. Equal average gains and losses produce an RSI of 50.
Wilder used a simple average to initialize the first value and then smoothed later gains and losses. A 14-period calculation needs 14 price changes before the first RSI appears.
Platforms may show slightly different values because of price feeds, candle boundaries, available history and initialization. A one-point gap isn’t a trading signal.
Does an RSI strategy work?
The indicator calculates past momentum correctly. Profitability depends on the rules built around it.
A large study tested 6,406 technical rules across 41 equity markets, including 600 RSI variations. Rules that looked strongest in the original sample generally did not keep that advantage on unseen data. Moderate transaction costs removed much of the measured performance.
For a useful test, I record the market, timeframe, settings, entry trigger, exit, spread, fees, slippage and results in trends and ranges separately.
My check before using an RSI signal
- Market condition: trend, range or unclear?
- Indicator reading: extreme, centerline cross or divergence?
- Price evidence: rejection, breakout, swing break or none?
- Timeframe: does RSI use the same candles as the trade decision?
- Invalidation: which price proves the idea wrong?
- Costs and size: does the trade still make sense after spread and risk limits?
If I cannot name the market condition and invalidation, the RSI number won’t rescue the setup.