Chart patterns are powerful tools and perhaps none more so than the Head & Shoulders. This is a reversal pattern that can indicate bullish or bearish shift in the market, can form in any time frame, is relatively easy to spot before it confirms and once confirmed virtually guarantees a strong move in the direction of reversal.
The pattern forms like this. Prices are moving up (in the case of an uptrend) and hit resistance. They retreat to support where they may consolidate and then move higher. This forms the first shoulder. On the bounce prices move up to exceed the first high but hit resistance again. This is the head. Once resistance has been hit prices fall back to the original support line, now called the neckline, where they consolidate again before bouncing higher. This second bounce forms the 2nd shoulder and will hit a high lower than the 2nd high forming a series of peaks that look like this.
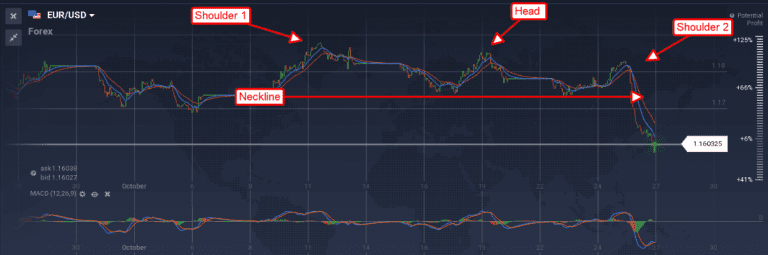
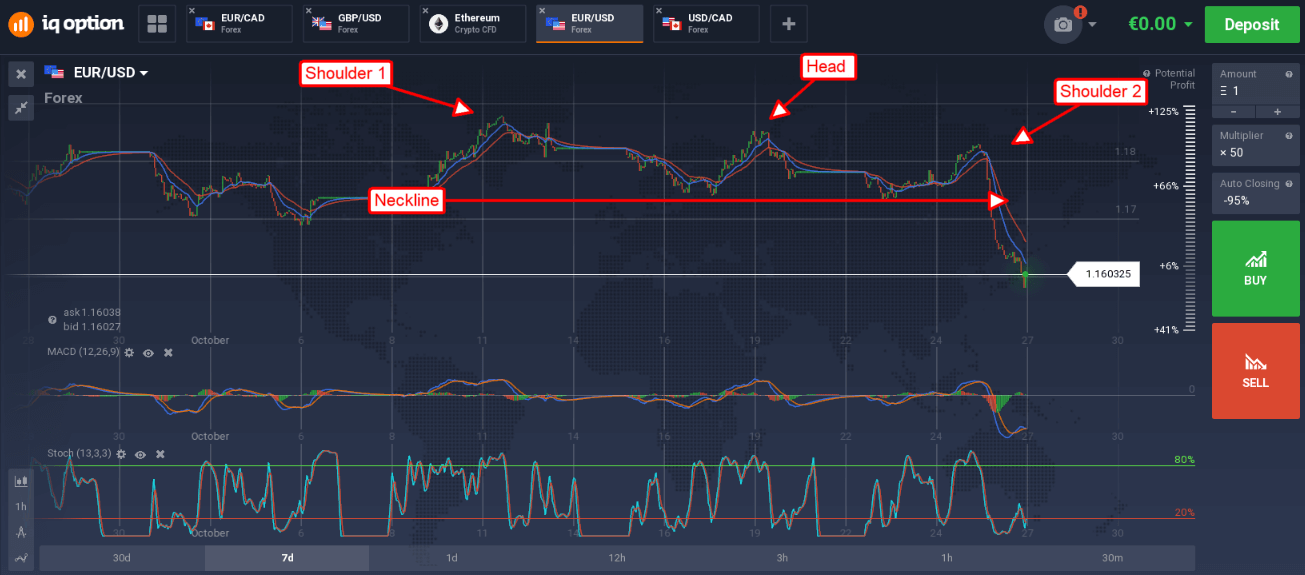
The above chart is 1-day candlesticks of the EUR/USD. You can see that prices move up to make a peak, fall to support and bounce, move up and make another higher peak, fall back to support and bounce to make the 2nd shoulder. Now that prices are breaking through the neckline the pattern is confirmed. This can lead to sharp moves to the downside, in line with the reversal, with target projected by the pattern itself. As with all price patterns magnitude plays a big part in the extend of moves once the patterns are confirmed. In this case the magnitude from the neckline to the top of the head is about 335 pips. This means that this reversal can be expected to move at least as low as 1.1340, if not further.
This pattern can also be found at the bottom of down trends as in the example below. This is the USD/CAD chart showing the pair has broken above resistance at a neckline. This move is already a bit extended but supported by the indicators so further upside should be expected. Upside target here is also equal to the magnitude of the H&S so near 1.3550.
The risk is that the move will not be straight up which brings me to my next point. Once the break out has occurred it is likely prices will move back to retest the neckline as support. If and when that happens a second entry is presented with an expectation for price movement up or down to projected targets.

So far, I’ve talked about trading the confirmation of the pattern and that is always the safest way to trade price patterns. That being said this pattern is easy to spot when it is forming and can be used to make shorter term trades than what the pattern itself may be indicating. For example, if the first shoulder and head have formed playing a call at the neckline in expectation of a bounce/2nd shoulder is not a bad trade. Likewise, if the it looks like a 2nd shoulder is forming it is not unwise to play puts/calls, especially if news or other indicators confirm the move as well.
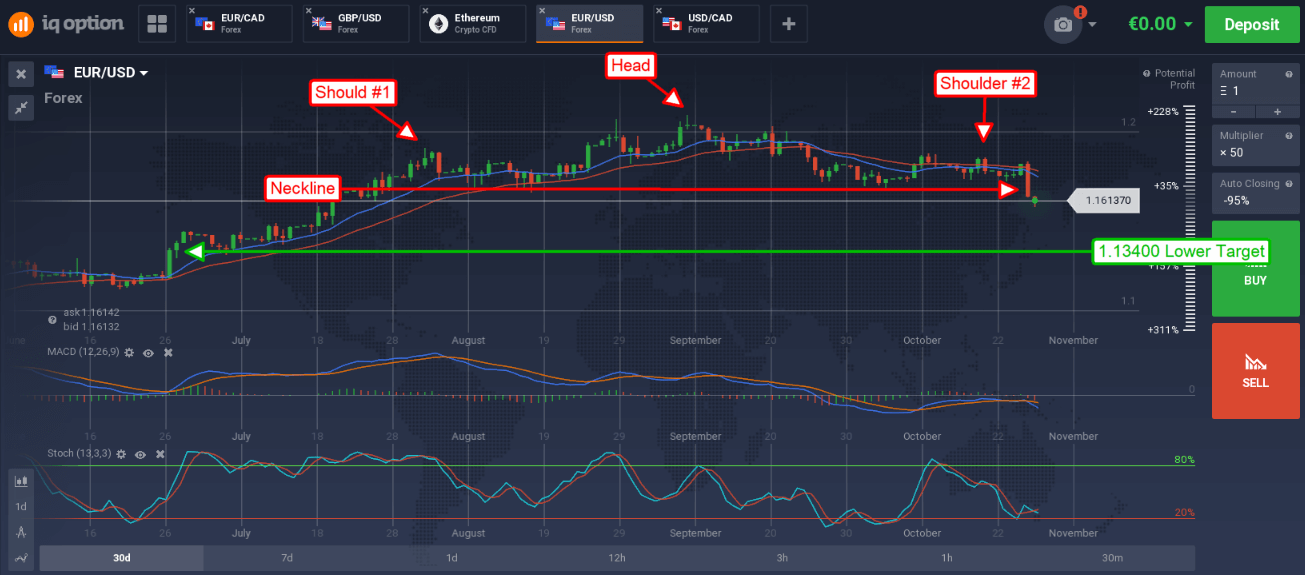
A characteristic I like about the H&S pattern is that it can form within itself. What I mean is, if a long-term pattern is forming with moves up to test support at the shoulder, head and shoulder each of those peaks may in fact be a shorter-term H&S pattern. Let’s refer to my first chart above and specifically to the right hand and #2 shoulder.
Dialing in to a 1-hour chart shows a clear H&S pattern forming with neckline near 1.1736. A break below this line, on bullish US data, has sent the pair down to test and break support at the greater neckline, thereby confirming both the short term and long-term reversal of the pair.