
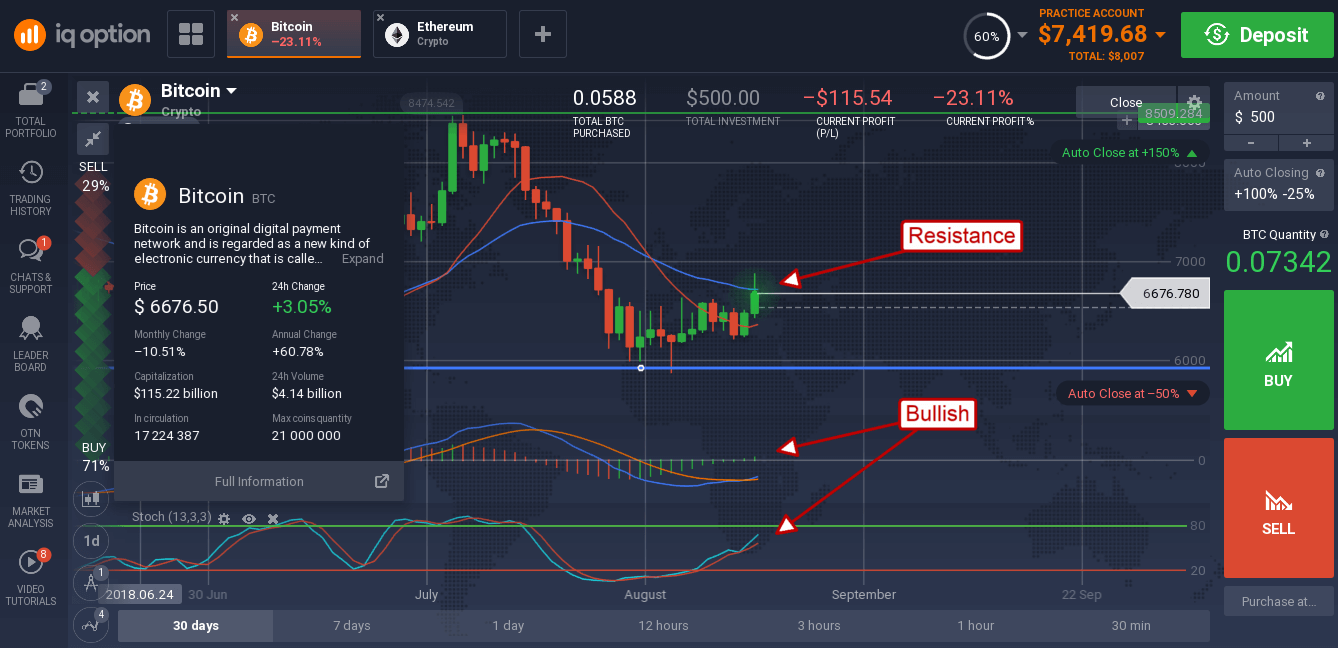
Bitcoin’s price saw a sudden spike in prices early on Wednesday as short-covering in the futures market led prices higher. The cause for the covering is simple, Bitcoin has been trading above key support for a long time with no signs of moving lower and there are positive catalysts on the horizon.
Key support is just below the $6,000 level and has been tested multiple times over the past 8 months. The catalyst is the anticipated SEC announcement concerning the future of a BTC or cryptocurrency-based ETF. The SEC is expected to make their announcement mid-August but postponed the decision raising hopes they would approve the request.
The SEC has already rejected the Winklevoss Twins BTC ETF request twice and could have said no to VanEck just as quickly. The fact they’ve chosen to wait an additional 45 days before making the decision has led some to speculate the SEC will change their stance.
The listing of a BTC/cryptocurrency-based ETF would be a monumental event for the market and that is why traders are closing their shorts. The SEC may disapprove the request which would be nothing new, but they might approve it and that will surely send BTC prices shooting up.
Despite short-covering in the futures market the overall downtrend in BTC remains intact. Today’s action moved up sharply to test the downtrend line for resistance and it was there. The test resulted in a mid-day selloff confirming resistance at the trendline and the short-term 30 day moving average. The indicators are bullish, so another test of resistance could come, a break and close above the trendline would be bullish for the coin.
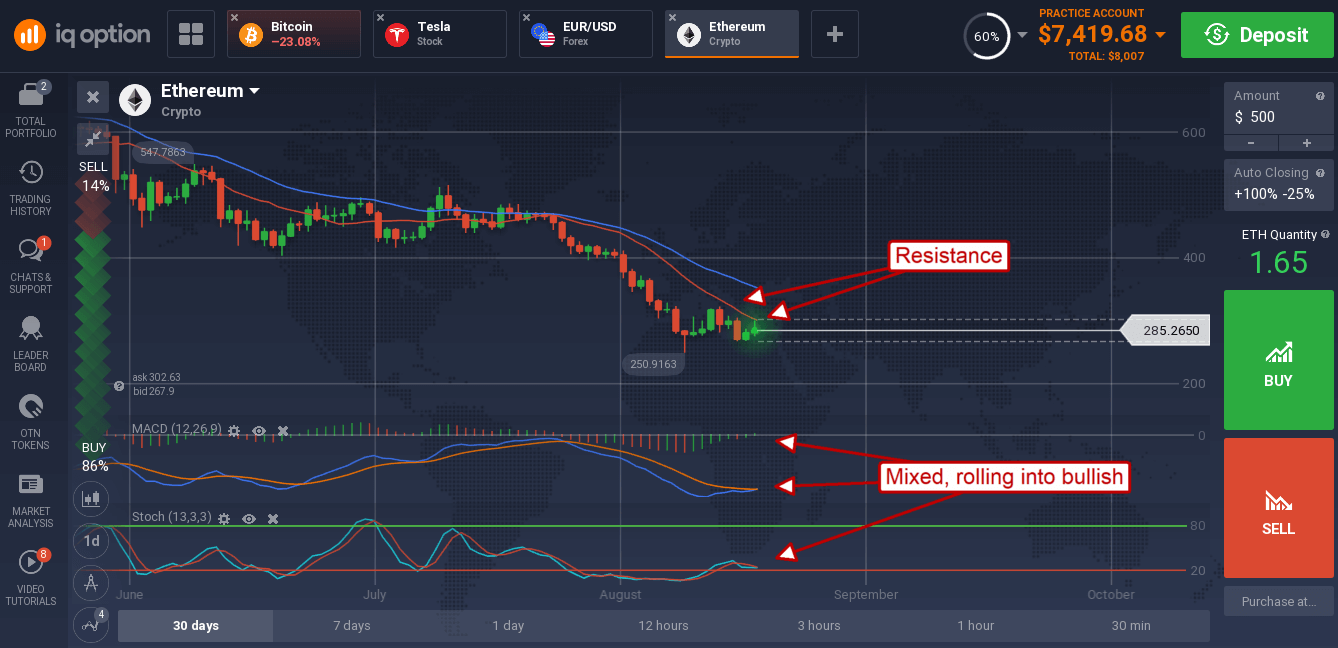
Other major cryptocurrencies were also affected as they too could be listed as individual ETFs or ETFs based on an index of tokens. The trouble is that moves in the ETH and LTC, the two most likely candidates for an ETF after BTC, were about half as large as that of BTC and below resistance targets. ETH for example has confirmed resistance in early Thursday trading and looks like it could continue its downtrend.
Litecoin advanced close to 3% in early trading but is still below the $60 level and well below the short-term moving average. The token is showing a strong buy indication in the MACD and stochastic, so a move could come if resistance can be broken.

In the near term a move to the short-term EMA near $66 is the most likely event, a break above that may be bullish longer-term.