

Open any market news app and you’ll see the same words again and again: bullish, bearish, rally, sell-off, momentum, reversal. For someone who’s just getting into trading or investing, that language can feel like a private club’s vocabulary. You sort of know it matters, but you may not be fully sure what it means in plain English.
At the center of that confusion is the idea of bullish vs bearish markets. These two terms are used to describe the general direction of price movement and the mood behind it. A market can be bullish when prices are rising or when traders expect them to rise. It can be bearish when prices are falling or when confidence starts to fade. That sounds simple enough, but in real markets, the line is not always obvious.
It also helps to know that these concepts are not limited to stocks. You’ll hear them in forex, crypto, commodities, indices, and pretty much any market where prices move.
Once you understand the difference, a lot of other trading concepts start making more sense too.
In this guide, we’ll explain what bullish and bearish markets are, how they differ, and how traders identify them in real market conditions.
What Does “Bullish” Mean in Trading?
A bullish market is one where prices are generally moving higher, or where the expectation is that they’re likely to move higher.
That’s the basic definition. But in practice, “bullish” is about more than just a few green candles or one strong day. It describes a market environment where buyers seem willing to keep stepping in, even after temporary pullbacks.
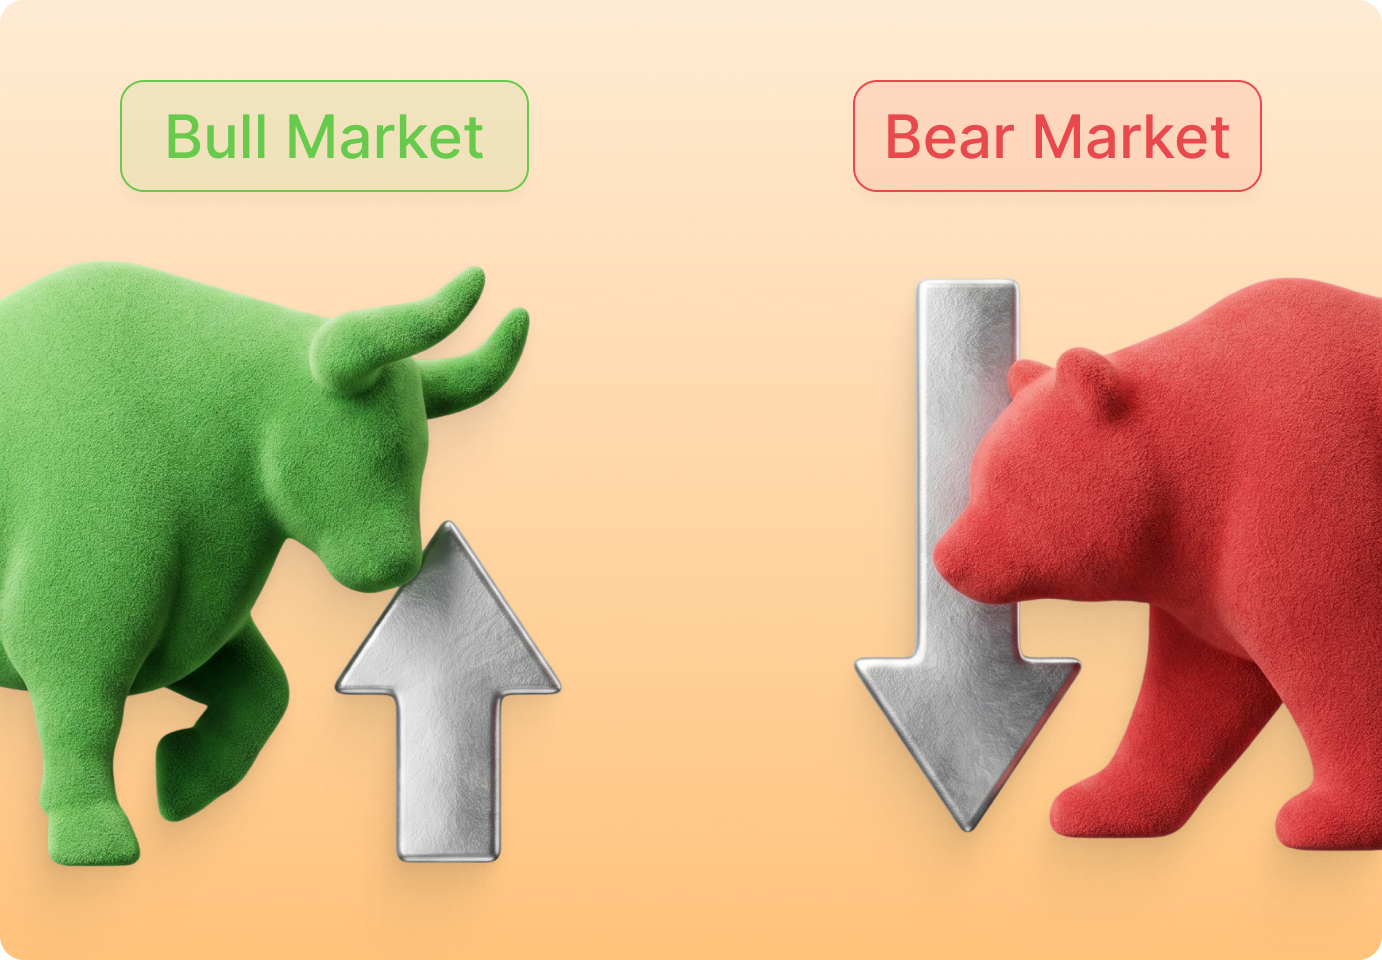
The term itself is often explained with a simple image: a bull thrusts upward with its horns. That upward motion became a symbol for rising markets.
You’ll usually notice a few things when a market turns bullish.
Higher highs and higher lows
This is one of the cleanest signs. Price pushes up, pulls back, and then rises again to a level above the previous peak. The next dip also stays above the last major low. That pattern suggests demand is holding up.
It’s not flashy, but it matters. When both highs and lows keep creeping upward, the market is telling you buyers still have the upper hand.
Positive sentiment
Bullish markets usually feel lighter. People become more confident. News is interpreted more positively. Traders get more comfortable buying dips instead of fearing them.
That does not mean everyone is euphoric. It just means the general mood leans toward confidence rather than caution.
Strong buying pressure
In bullish conditions, pullbacks often attract buyers. Instead of sharp selling taking over, price tends to find support and recover. That behavior is a clue that demand is still there.
Momentum that keeps rebuilding
A healthy uptrend does not move in a straight line, but it tends to recover from weakness fairly well. That resilience is often what separates a real bullish trend from a short-lived bounce.
So, in plain terms, bull market meaning comes down to this: prices are trending higher, buyers are active, and the overall tone of the market is constructive.
What Does “Bearish” Mean in Trading?
A bearish market is one where prices are generally moving lower, or where market participants expect them to fall.
Just like bullishness is not about a single good day, bearishness is not about one ugly session. A bearish market has a broader pattern behind it. It’s the kind of environment where rallies struggle, confidence weakens, and sellers keep finding reasons to stay active.
The bear comparison comes from the way a bear attacks, swiping downward. That downward motion became a symbol for falling prices.
A bearish market usually comes with a different set of signals.
Lower highs and lower lows
This is the mirror image of an uptrend. Price drops, tries to recover, but fails to get back to the previous high. Then it falls again and breaks lower. That sequence tells you the market is losing strength.
Even when buyers show up, they are not strong enough to fully reverse the direction.
Negative sentiment
Bearish markets tend to feel heavier. Traders become more cautious. Investors get more defensive. Good news may get ignored, while bad news hits harder than usual.
That shift in mood often matters as much as the chart itself.
Selling pressure
In a bearish environment, upward moves often fade faster than expected. A bounce that looks promising in the morning can turn into fresh weakness later. That repeated failure is a sign that sellers are still in control.
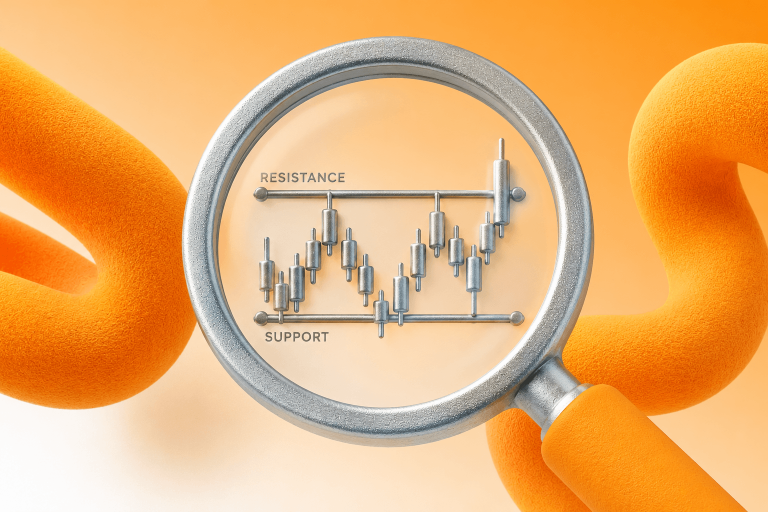
Weak support
Instead of buyers confidently stepping in on dips, price may keep sliding through areas where support once held. That’s another clue the market structure is changing.
So the simplest bear market meaning is this: prices are falling, confidence is weaker, and sellers are leading the market.
Bullish vs Bearish Markets — Key Differences
The easiest way to understand a bullish vs bearish market is to compare them side by side.
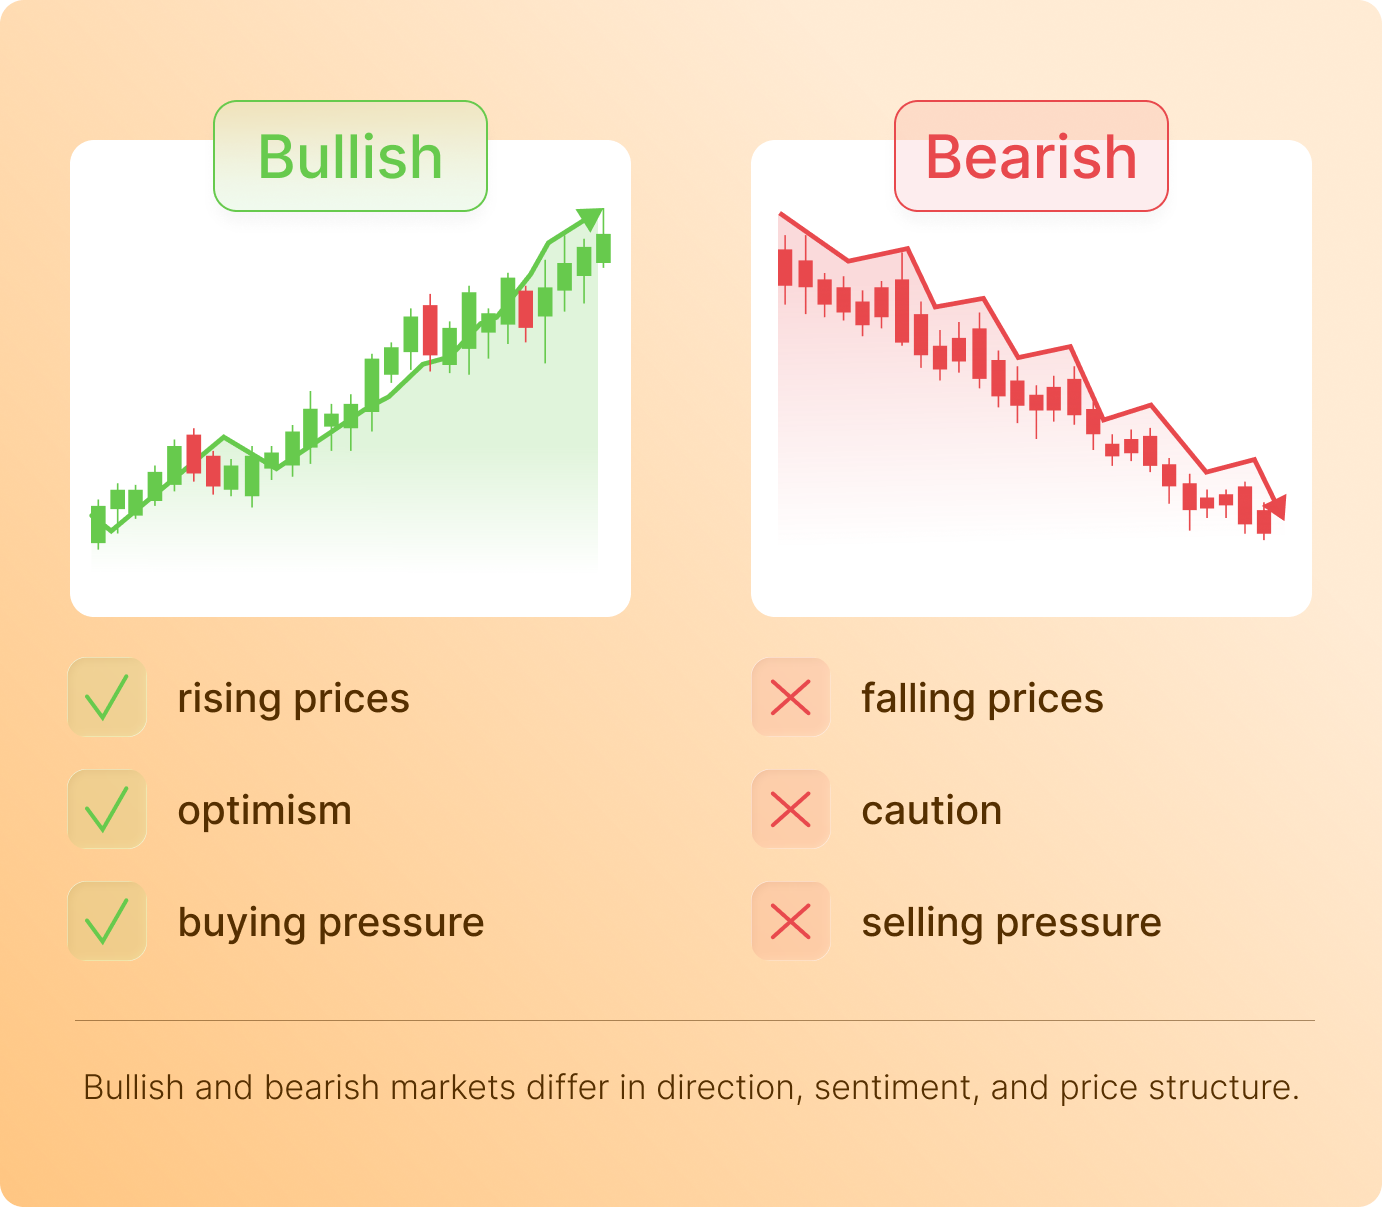
| Feature | Bullish Market | Bearish Market |
| Direction | Uptrend | Downtrend |
| Sentiment | Optimistic | Pessimistic |
| Price structure | Higher highs | Lower highs |
| Behavior | Buying | Selling |
That table is simple on purpose, because beginner confusion usually starts when these ideas are made more complicated than they need to be.
A bullish market is not just “good,” and a bearish market is not just “bad.” They are different conditions. They tell you who currently has more control: buyers or sellers.
In a bullish phase, markets tend to reward patience a little more. Pullbacks can look like pauses instead of breakdowns. In a bearish phase, that logic flips. Rallies often turn into relief moves rather than signs of real strength.
Another thing worth remembering: these labels depend on timeframe.
A market might look bearish over the last three days but still be clearly bullish over the last three months. That is why people often talk past each other when discussing trends. They are looking at different charts or different time horizons.
So when comparing bullish vs bearish, always ask one quiet question first: over what period?
That one detail clears up a lot of confusion.
What Causes Bull and Bear Markets?
Markets do not become bullish or bearish for one single reason. Usually, several forces start pointing in the same direction at once.
What can drive a bullish market?
A rising market often appears when confidence improves. That confidence can come from a few places.
Economic growth
When the economy is doing well, businesses may earn more, consumers may spend more, and investors often feel more comfortable taking risk.
Strong company earnings
If companies are reporting solid results, the market may start pricing in more strength ahead. Better earnings can support higher valuations and a more optimistic tone.
Positive news
Constructive headlines can help. That could mean stronger data, reduced uncertainty, or signs that a difficult period is easing.
Lower interest rates
Lower rates can make borrowing cheaper and can support growth. They can also make risk assets more attractive in relative terms.
What can drive a bearish market?
A bearish market usually starts when confidence weakens or when future expectations get worse.
Economic slowdown
If growth looks fragile, markets may start adjusting before the damage is obvious to everyone.
Uncertainty
Markets do not like uncertainty for long. When investors become unsure about what comes next, they often turn more defensive.
Rising interest rates
Higher rates can pressure valuations, raise financing costs, and make the investing environment tougher.
Negative news
Poor earnings, weak guidance, macro concerns, or broad fear can all feed into a downtrend.
The important point here is that trends are often driven by expectations. Markets are forward-looking. They react not only to what is happening now, but to what participants think may happen next.
How to Identify a Bullish Market
If you’re learning how to identify bull market conditions, start with what price is actually doing, not what people are loudly predicting.
Look at the trend structure first
This is the most useful starting point for beginners. Is the market making higher highs and higher lows? If yes, that’s a strong sign of bullish structure.
It sounds basic, but it works because it forces you to pay attention to behavior rather than headlines.
Check whether price is holding above a moving average
A moving average smooths out price data and gives you a cleaner view of direction. When price stays above an important average and keeps bouncing from it, that often supports the bullish case.
You do not need to get lost in indicator settings here. The idea is simple: if price is living above its average, the market may still be trending upward.
Pay attention to sentiment
Bullish markets often come with a certain feel. Dips get bought. Breakouts attract attention. Optimism builds gradually. Participants seem more willing to stay involved.
Watch how the market reacts to weakness
This is underrated. In a bullish market, bad days often fail to do lasting damage. Price may dip, but buyers come back sooner than expected. That reaction tells you a lot.
So if you want a practical answer to how to identify bull market conditions, it is this: rising structure, support above key averages, constructive sentiment, and steady demand on pullbacks.
How to Identify a Bearish Market
Learning how to identify bear market conditions follows the same logic, just in reverse.
Start with market structure
If the chart is making lower highs and lower lows, you are likely dealing with bearish conditions. That pattern tells you every recovery attempt is weaker than the last one.
See where price sits relative to its average
When price stays below a moving average and struggles to reclaim it, that often points to weakness rather than strength.
Again, the moving average is not the full story. It is just one helpful piece of context.
Read the mood of the market
In bearish periods, fear tends to show up faster. Traders sell into rallies. Investors get cautious. News feels heavier. Confidence fades more easily.
Notice how rallies behave
This is a big one. In a bearish market, upward moves often look hopeful at first, then stall, then roll over. Those failed rallies are often more revealing than the sell-offs themselves.
The practical definition of how to identify bear market conditions is not complicated: weak price structure, repeated failed rebounds, price below average direction, and a market tone that leans defensive.
Bullish and Bearish Trends vs Short-Term Movements
This is where many beginners get tripped up.
Markets do not move in neat, uninterrupted lines. Even a strong bullish trend will have red days, pullbacks, and periods that feel uncomfortable. And even a bearish market can stage sudden, aggressive rallies.
That does not make the trend meaningless. It just means trends need room to breathe.
A bullish trend can dip for a week and still remain bullish. A bearish trend can rally sharply for a few days and still remain bearish. The mistake is assuming every short-term move signals a full reversal.
What matters is whether the larger pattern changes.
Is the bullish market still making higher lows after the pullback? Then it may just be a correction.
Is the bearish market rallying but still failing below prior highs? Then it may just be a temporary rebound.
This distinction matters because it helps you stop reacting to every move as if it changes everything.
Short-term movements are part of market life. Trends are the broader story.
How Traders and Investors React to Market Conditions
Market direction changes behavior. That’s true for professionals, beginners, investors, and short-term traders alike.
In bull markets
When prices are generally rising, people often become more comfortable being patient. Pullbacks may look like opportunities rather than threats. Holding periods can become longer because the broader trend supports the position.
Trend-following ideas tend to make more sense here. Some traders also pay closer attention to buying pullbacks in strong markets rather than chasing every breakout.
In bear markets
Bearish conditions usually create a more defensive mindset. Investors may reduce exposure, become more selective, or hold more cash. Traders may focus more on capital protection than on chasing upside.
More advanced participants may explore short-selling, but for beginners, the bigger lesson is simpler: bear markets usually punish overconfidence more quickly.
The emotional shift matters
Bull markets often make people feel smarter than they are. Bear markets often make people feel later than they are. Both can distort judgment.
That’s why understanding context matters so much. A market’s direction influences not only price, but also the behavior and emotions around it.
Why Understanding Market Direction Matters
Knowing whether the market is bullish or bearish will not tell you the future. But it will tell you what kind of environment you’re in.
That’s a big advantage.
It helps with timing
A dip in a strong uptrend often means something very different from a dip in a weak downtrend. Without context, those two situations can look similar. With context, they are easier to separate.
It supports better risk awareness
When the market is under pressure, volatility can behave differently. When the market is trending smoothly, patience may be rewarded more often. Recognizing the environment helps you think more clearly about risk.
It stops you from fighting the obvious
Beginners often try to outsmart the market by calling tops and bottoms too early. Sometimes the smarter move is simply admitting what the chart is already showing.
A helpful phrase here is:
The trend is your context, not a guarantee.
That line matters because trends can fail. But until they clearly do, they still provide useful information.
Common Beginner Mistakes
Most confusion around market trends explained comes from a handful of repeated mistakes.
Mistaking noise for trend
A couple of strong candles do not automatically create a bull market. A few bad sessions do not automatically create a bear market. Looking at too little data can make normal movement seem more dramatic than it really is.
Trading against strong momentum
A market that feels “too high” can keep rising. A market that feels “too low” can keep falling. Many beginners get trapped trying to be early instead of trying to be accurate.
Overreacting to headlines
News matters, but price structure matters too. Sometimes the market absorbs bad news and keeps climbing. Sometimes it ignores good news and keeps falling. That disconnect surprises beginners all the time.
Ignoring higher highs and lower lows
Market structure is not glamorous, but it is useful. When traders skip it, they often lose the clearest clue they have.
Expecting certainty
Markets are not math equations. You are not looking for guarantees. You are looking for evidence. That mindset shift makes a huge difference.
Simple Example: A Visual Explanation
Let’s keep it easy.
Imagine a stock rises from $40 to $46. Then it slips back to $44. After that, it climbs to $49, dips to $47, and then pushes to $52.
That is a pretty clean bullish pattern. The highs keep rising. The lows keep rising too. Buyers are stepping in before price falls too far.
Now imagine the next part looks different.
Instead of moving from $52 to a new high, the stock slips to $48, bounces to only $50, and then falls to $45. After that, it rallies again, but only to $47 before dropping lower.
That is where the tone starts to change. The rebounds are weaker. The price is no longer making higher highs. It is starting to build lower highs instead.
That does not automatically confirm a long-term reversal, but it does suggest the bullish structure is weakening and a bearish one may be forming.
This is why charts matter. Not because they predict the future perfectly, but because they help you see whether market behavior is staying consistent or starting to shift.
Final Thoughts
Once you understand bullish vs bearish market behavior, a lot of financial language becomes much easier to read.
A bullish market is built on rising prices, stronger demand, and a pattern of higher highs and higher lows. A bearish market reflects falling prices, weaker sentiment, and lower highs with lower lows. That’s the foundation.
The harder part is not memorizing the definitions. It’s learning not to get distracted by every short-term move. Markets can wobble inside an uptrend. They can bounce inside a downtrend. Context matters more than any single candle or headline.
For beginners, that’s probably the most useful takeaway: do not ask only whether price moved today. Ask how it has been behaving over time.
That’s where trend recognition starts. And that’s where smarter market understanding begins.