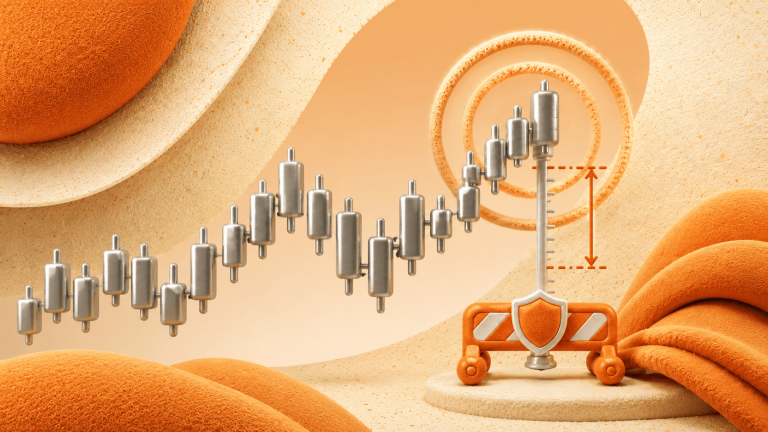


A wick through resistance tells me very little on its own. It may start a breakout or mark a brief move above the level followed by a fast return.
I do not try to name the move while the breakout candle is still forming; I wait for price to show whether it can stay beyond the level.
My working distinction is simple:
- Possible liquidity sweep: price trades beyond an obvious level, closes back inside the prior range, and cannot reclaim the level on the next attempt.
- Possible breakout: price closes beyond the level, keeps trading there, and treats the old boundary as support or resistance.
- No clear answer: price keeps crossing the level in both directions. I skip it.
First read
The reaction after the level breaks matters most
| Check | Possible liquidity sweep | Possible breakout |
|---|---|---|
| Close | Returns inside the prior range | Finishes beyond the full zone |
| Next candles | Fail to reclaim the crossed level | Keep trading outside the old range |
| Retest | Rejects from the original side | Old boundary holds from the new side |
| Decision | Consider reversal only after confirmation | Consider continuation only with room ahead |
If price keeps crossing the level in both directions, there is no clean read. Waiting is a decision.
A sweep can still turn into a breakout, and a breakout can fail later.
A note on the term “liquidity sweep”
Traders use liquidity sweep for a move through a visible high, low, support zone, or resistance zone that quickly returns. The phrase often comes with a story: stops were clustered beyond the level, those stops were triggered, and larger participants used the resulting orders.
Stop orders often sit around obvious chart levels. FINRA warns that a short-lived price move can trigger them before the market returns toward its previous price.
But a chart does not reveal who caused the move or why. It shows prices and, depending on the market, some form of volume. It does not prove that an institution deliberately hunted retail stops.
So I use sweep as a description of price behavior, not proof of intent. False breakout is the more neutral term for much of the same observable sequence.
The five checks
I use the same checks above resistance and below support.
1. Where did the candle close?
The first question is not how far the wick travelled, but where the candle finished relative to the zone.
For an upside move:
- A close back below resistance supports the sweep idea.
- A close above resistance supports the breakout idea.
- A close in the middle of a wide zone tells me nothing.
For a downside move, reverse those conditions.
I treat support and resistance as zones rather than exact prices. A candle that closes one tick above a line has not necessarily broken anything. The close needs to clear the area that price had been rejecting.
A bullish breakout candle that closes near its high shows less immediate rejection than one that gives back most of the move.
I always wait for the candle on my execution timeframe to close. A five-minute wick may look dramatic after two minutes and disappear before the candle finishes.
2. What happens after the first break?
The next few candles often tell me more than the break itself.
After a possible breakout, I look for:
- Price staying outside the old range.
- A shallow pullback rather than an immediate collapse.
- The broken level acting as support after an upside break, or resistance after a downside break.
- New closes in the breakout direction.
After a possible sweep, I look for:
- Price returning inside the prior range.
- A failed attempt to reclaim the swept level.
- A break of the sweep candle’s opposite end or a nearby minor swing.
- Momentum moving away from the level, not hovering around it.
I do not require a retest, but the reaction is useful when price comes back.
Time also matters. The CMT Association notes that technicians can use time spent beyond resistance and the amount of penetration as breakout filters. There is no universal number of candles that makes a break real. On my chart, one close creates a candidate. Holding through the next one to three candles gives me more information.
If those candles alternate above and below the level, there is no acceptance. That is usually enough for me to leave the chart alone.
3. Where is the move happening?
The same wick can mean different things in different locations.
I mark three pieces of context before looking for an entry:
- The higher-timeframe direction.
- The level being crossed.
- The next area where price may react.
An upside break from a tight intraday range can be useful when the one-hour trend is already rising and there is room before the next daily resistance zone.
The same break is less attractive if it runs straight into a previous weekly high. Price may clear the intraday level and still have nowhere useful to go.
Range context changes the read as well. Repeated failed breaks at both edges suggest a two-sided market. In that environment, a wick outside the range is more likely to be treated as rejection until price proves otherwise.
In a directional market, fading every new high because it looks like a sweep can become expensive. If higher highs hold, pullbacks stay shallow, and broken resistance keeps turning into support, I give continuation more weight.
I am not using the level to predict a reversal. I am checking whether price is being accepted on one side of it.
4. Did participation expand, or was it one isolated spike?
I use volume and candle pace as supporting evidence. Neither one decides the trade.
For exchange-traded stocks and futures, I compare the breakout bar with the same session:
- Is volume higher than the recent baseline?
- Did the candle range expand?
- Did later candles add to the move?
- Did activity disappear immediately after the level broke?
A breakout with broader participation has a different profile from one thin spike. Still, high volume does not guarantee continuation. It can also mark exhaustion or a fight between buyers and sellers.
Forex needs more care. The spot FX market is largely over the counter and has no single centralized exchange. The volume shown on a retail chart may represent ticks or activity from a particular data source, not all global FX trading. I treat it as a local activity measure, not a complete count of market participation.
When volume data is limited, I watch price behavior instead:
- Candle ranges expanding after the break.
- Closes staying near the direction of travel.
- Pullbacks taking more time and covering less distance than the impulse.
- The move continuing during an active session rather than dying at once.
One large candle is still only one candle. Without follow-through, it tells me little.
5. Can I define invalidation without chasing the price?
Even a clean chart read can make a poor trade if the entry comes too late, so I define what would prove the idea wrong before entering.
For a breakout setup, the idea weakens if price returns inside the old range and starts closing there. A stop may sit beyond the retest structure or another level that should hold.
For a sweep reversal, the idea weakens if price reclaims the swept level and stays beyond the sweep extreme. Placing a stop directly on the obvious high or low can leave no room for normal retesting.
Then I compare the distance to invalidation with the space to the next realistic target. If confirmation arrived so late that the target is close and the stop is far away, I pass.
Waiting for confirmation may mean a worse entry. I do not compensate by moving the stop closer until the numbers look better.
Five checks before the entry
Read them in order. A strong answer to check five cannot repair a weak answer to check one.
-
Close
Inside or outside the full zone?
-
Hold
What did the next candles accept?
-
Context
Trend, range, and next level.
-
Participation
Follow-through or one isolated spike?
-
Invalidation
Where is the idea clearly wrong?
Mixed answers mean no entry. The label can wait.
Two paired chart scenarios
These four sequences are hypothetical. They show the price behavior I compare, not past trades or results.
Hypothetical chart sequences
The wick is only the first clue
Dashed line = prior support or resistance
Hypothetical 01
Upside breakout
Hypothetical 02
Upside sweep
Hypothetical 03
Downside breakout
Hypothetical 04
Downside sweep
These diagrams use invented candle shapes to explain the sequence. They do not show an asset, date, price, trade, or result.
At resistance: breakout or sweep
Suppose price returns to an intraday resistance zone that has already held twice.
Breakout version
The candle closes above the full zone, the next candle stays there, and a retest holds from above. If the higher timeframe is rising and there is room before the next resistance, I treat it as a breakout candidate. Acceptance back inside the range would weaken the idea.
Sweep version
Price trades above the same zone but closes back inside. The next attempt cannot reclaim resistance and price moves below the sweep candle’s low. I treat it as a sweep candidate only after that failed reclaim, especially in a range or near higher-timeframe resistance.
At support: breakdown or sweep
Now suppose price trades below a visible support zone.
Breakdown version
Price closes below support, tests the old boundary from underneath, and turns lower. If the wider trend is already down, I treat that as a breakdown candidate rather than buying the first lower wick.
Sweep version
Price trades below support but closes back above it. The next pullback holds over the reclaimed zone and short-term lows begin to rise. That supports a sweep reading, though a new close below the zone would cancel it.
Where these reads fail
The sweep keeps moving in the original direction
A candle may close back inside, pause, and break out on the next attempt.
The breakout holds, then fails later
Two closes outside a range are evidence, not a guarantee.
The retest never comes
Sometimes price leaves without a clean entry. Chasing changes the stop distance and risk.
The chart is too noisy
On very short timeframes, normal price movement can cross a narrow level repeatedly. If the zone is smaller than the instrument’s usual noise, the sweep/breakout label does not help.
A scheduled release hits
Economic data can move price through several levels before a candle closes. Spreads may widen and execution may differ from the requested price. I either use a plan built for that event or wait.
Risk notes I keep beside the chart
- A liquidity sweep is not a buy or sell signal by itself.
- Technical analysis does not identify the intent behind an order.
- Stop orders can be triggered by brief price moves. Execution may occur away from the stop price in volatile conditions.
- Volume means different things across stocks, futures, forex, and other products.
- Lower timeframes create more apparent sweeps because they contain more noise.
- The payout, expiry, margin, and loss mechanics depend on the instrument. Check the terms before trading.
- No confirmation rule removes market risk.
I choose the amount at risk before the entry. A setup that looks unusually clean does not earn a larger loss limit.
My compact pre-entry checklist
- Did price close clearly inside or outside the zone?
- Did the next candles hold, reclaim, or reject the level?
- Does the higher-timeframe context support continuation or reversal?
- Is there real follow-through, not only one spike?
- Can I place a logical invalidation and still have room to the target?
If I cannot answer one of those questions, I wait. If price keeps crossing the same level, I stop trying to force a label onto it.