

Parabolic SAR indicator is a technical analysis tool developed by Welles J. Wilder. It stands for “stop and reverse”. The main goal of this indicator is to follow the price action over a certain period of time and identify possible trend reversals.
✍️
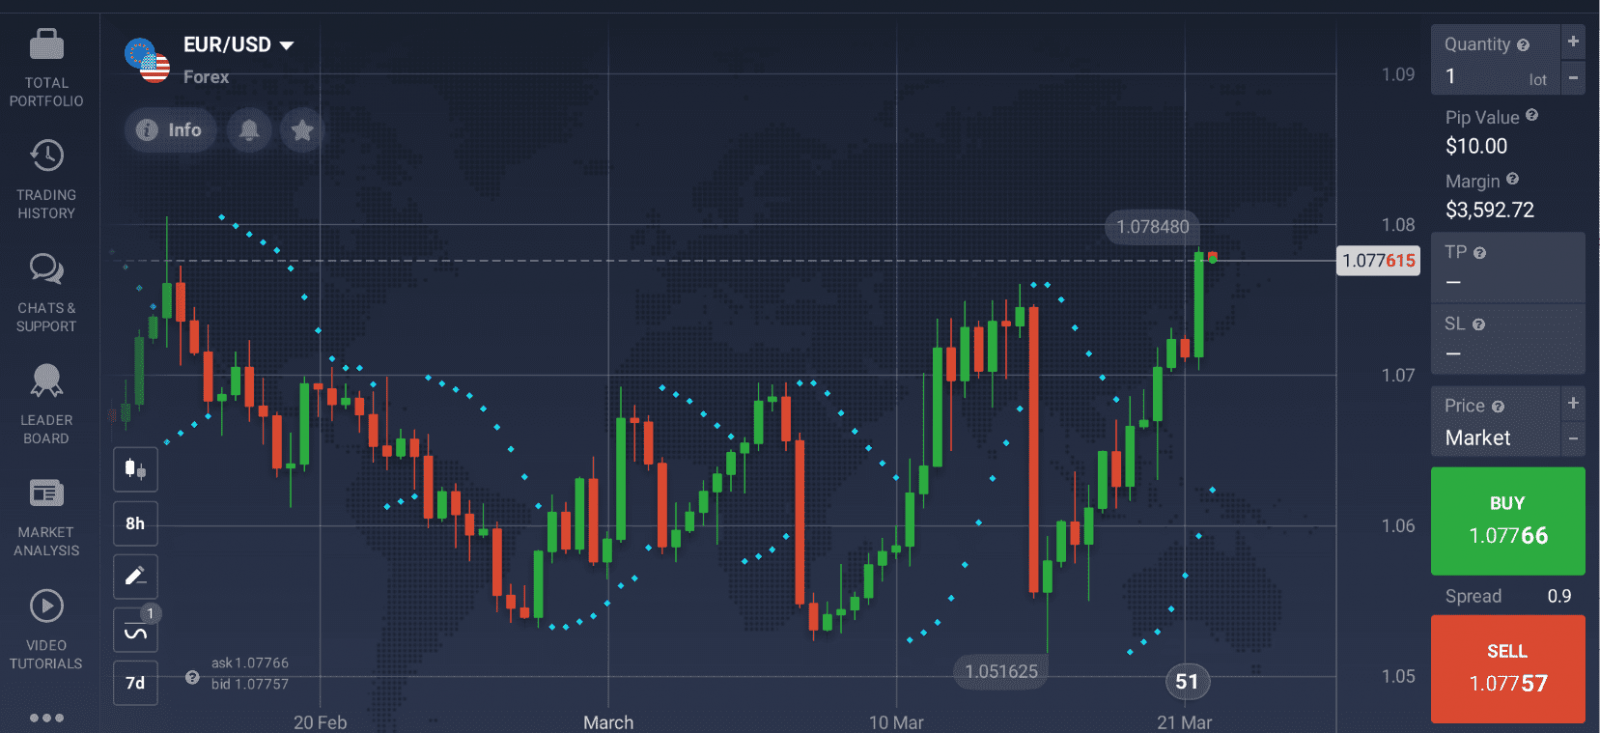
In order to understand how to use Parabolic SAR indicator effectively, it is crucial to know how it works. So let’s go over the main features and learn more about the Parabolic SAR settings, as well as possible indicator combinations.
How does Parabolic SAR work?
The idea behind the indicator is quite simple. When the price crosses one of the Parabolic SAR dots, the indicator may be expected to turn around and appear on the opposite side of the price line. Such behavior may be considered as a sign of an upcoming trend reversal or at least a trend slowdown.
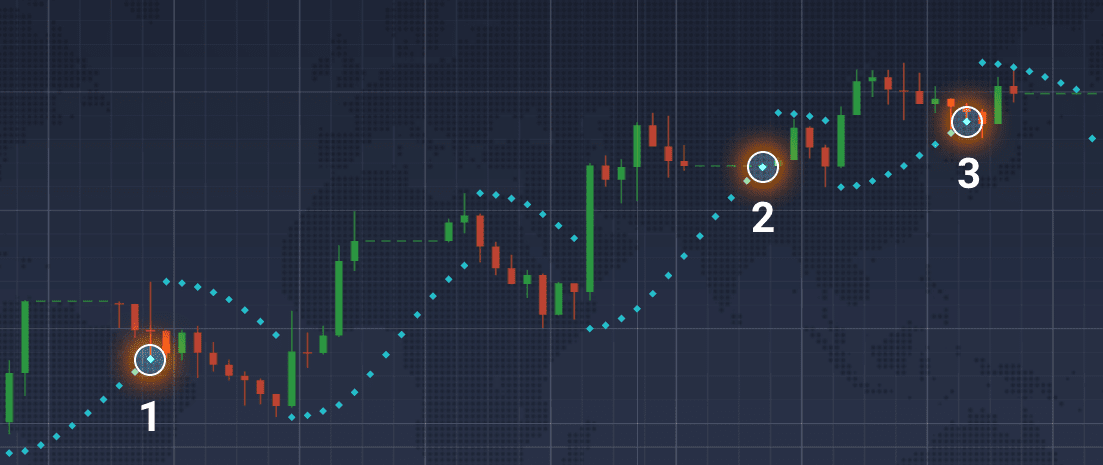
It can be seen in the picture above that when the Parabolic SAR indicator touches the price, the trend changes its direction. Additionally, this indicator may also be useful for estimating optimal entry/exit points.
Parabolic SAR settings for intraday trading
In order to use Parabolic SAR technical analysis indicator, you may take the following steps.
1. Click on the ‘Indicators’ section in the bottom-left corner of the screen;
2. Go to the ‘Trend’ tab;
3. Choose Parabolic SAR from the list of available indicators.
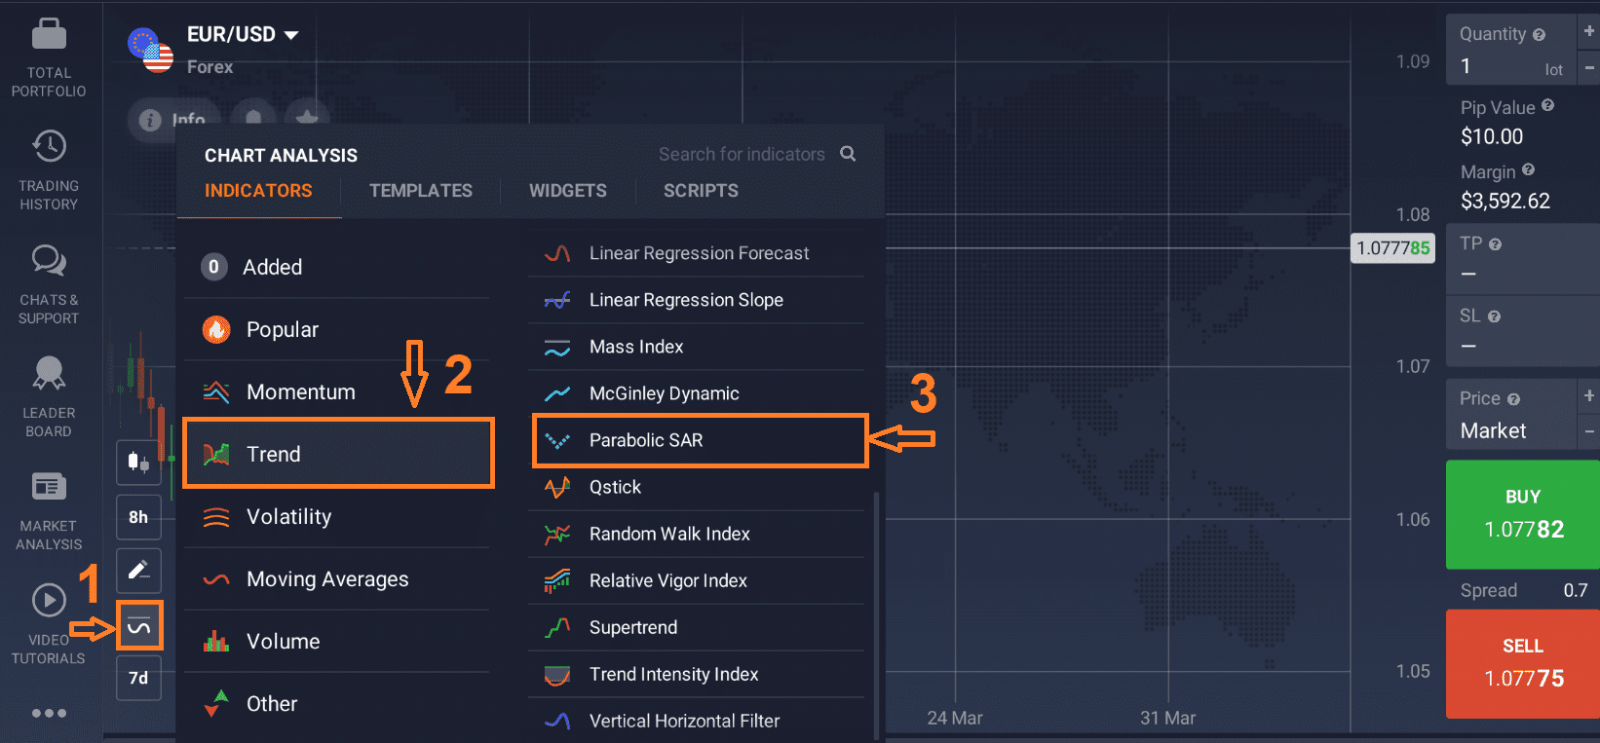
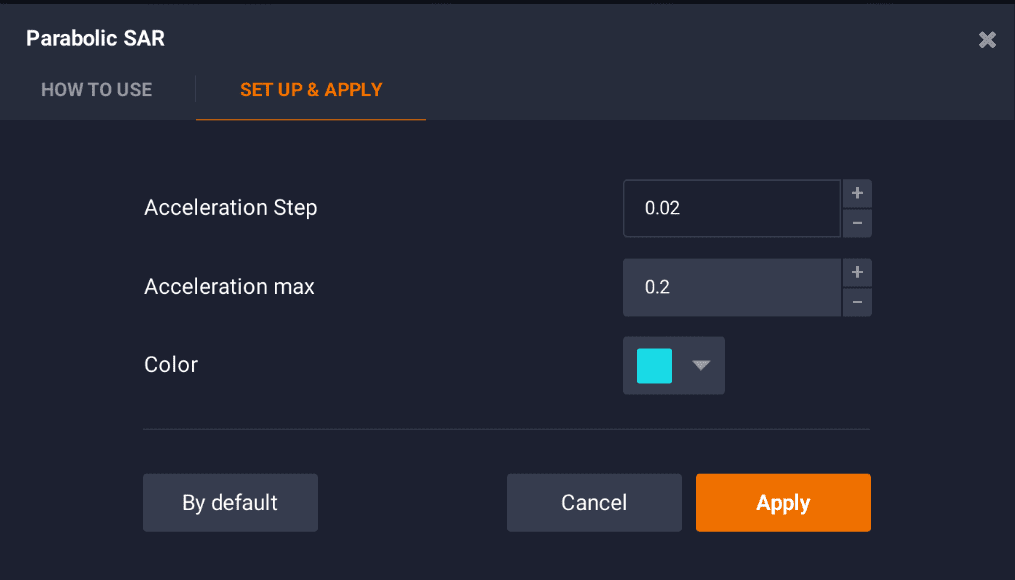
4. Click ‘Apply’ if you want to use the indicator with standard parameters. Or switch to the ‘Set Up & Apply’ tab and configure the indicator according to your liking.
✍️
The opposite effect can be achieved by lowering the values of acceleration and acceleration max: the indicator will become less sensitive but will also provide less false signals.
Finding the right balance between accuracy and sensitivity is a prime task for traders interested in using Parabolic SAR settings for intraday trading.
How to use Parabolic SAR indicator effectively?
According to Welles J. Wilder himself, the indicator should only be used during strong trends, that usually do not exceed 30% of the time. The use of Parabolic SAR on short time intervals and during the sideways movement is not advised as the indicator loses its predictive potential and can return false signals.
Professional traders often combine this tool with other indicators to use the Parabolic SAR effectively. One of the possible combinations — Parabolic SAR and Simple Moving Average — and its practical applications are described below. It is advised to double-check Parabolic SAR signals with the help of other indicators.
Parabolic SAR and SMA combination
The combination of these two technical analysis tools is popular among experienced traders. In this case, the Parabolic SAR settings may be applied as acceleration = 0.04, acceleration max = 0.4. The SMA may be set at period = 55. When used together, these two indicators might be able to confirm each other’s signals.
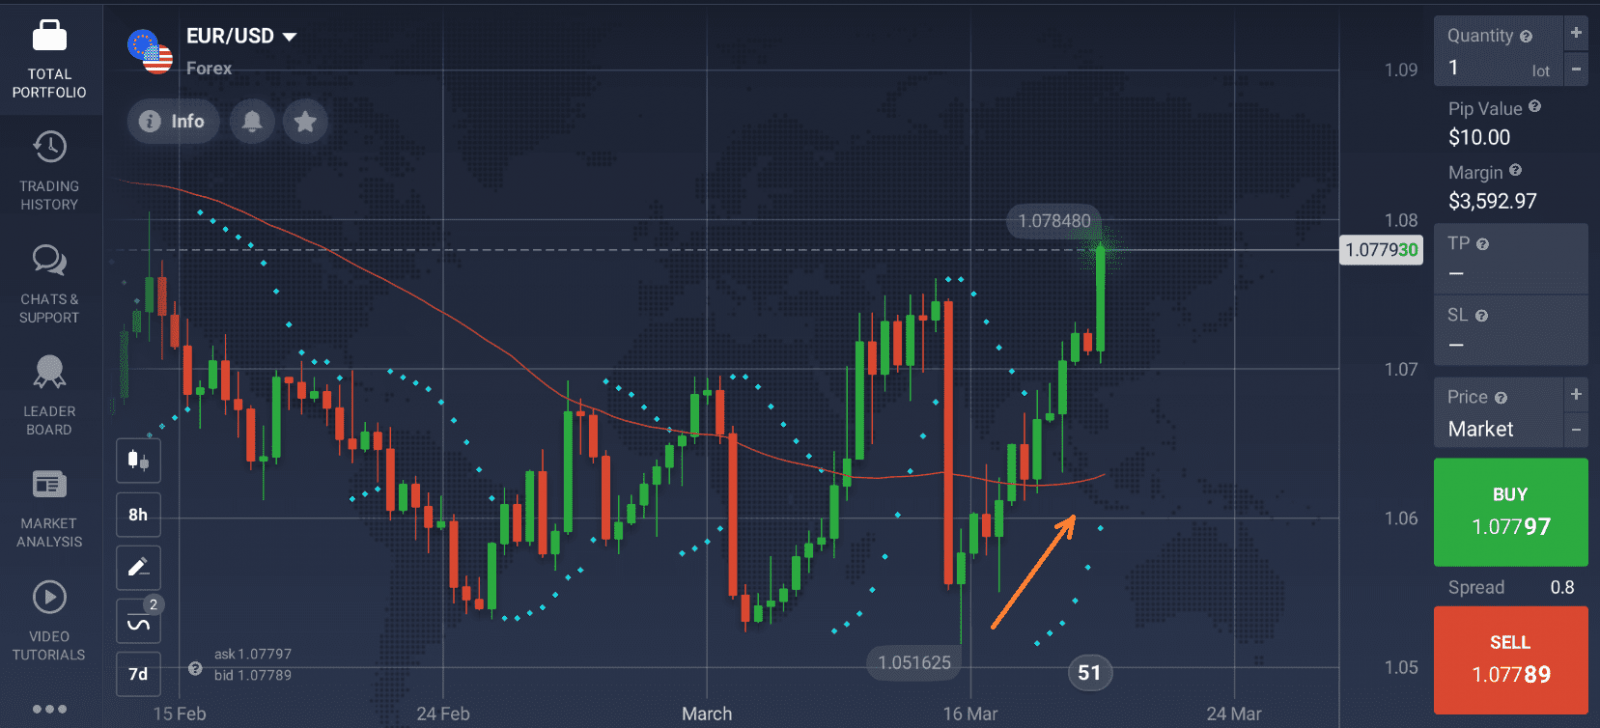
Anticipating a bullish trend
A bullish trend may be coming up if:
- The price is below the SMA line;
- The Parabolic SAR demonstrates upward movement.
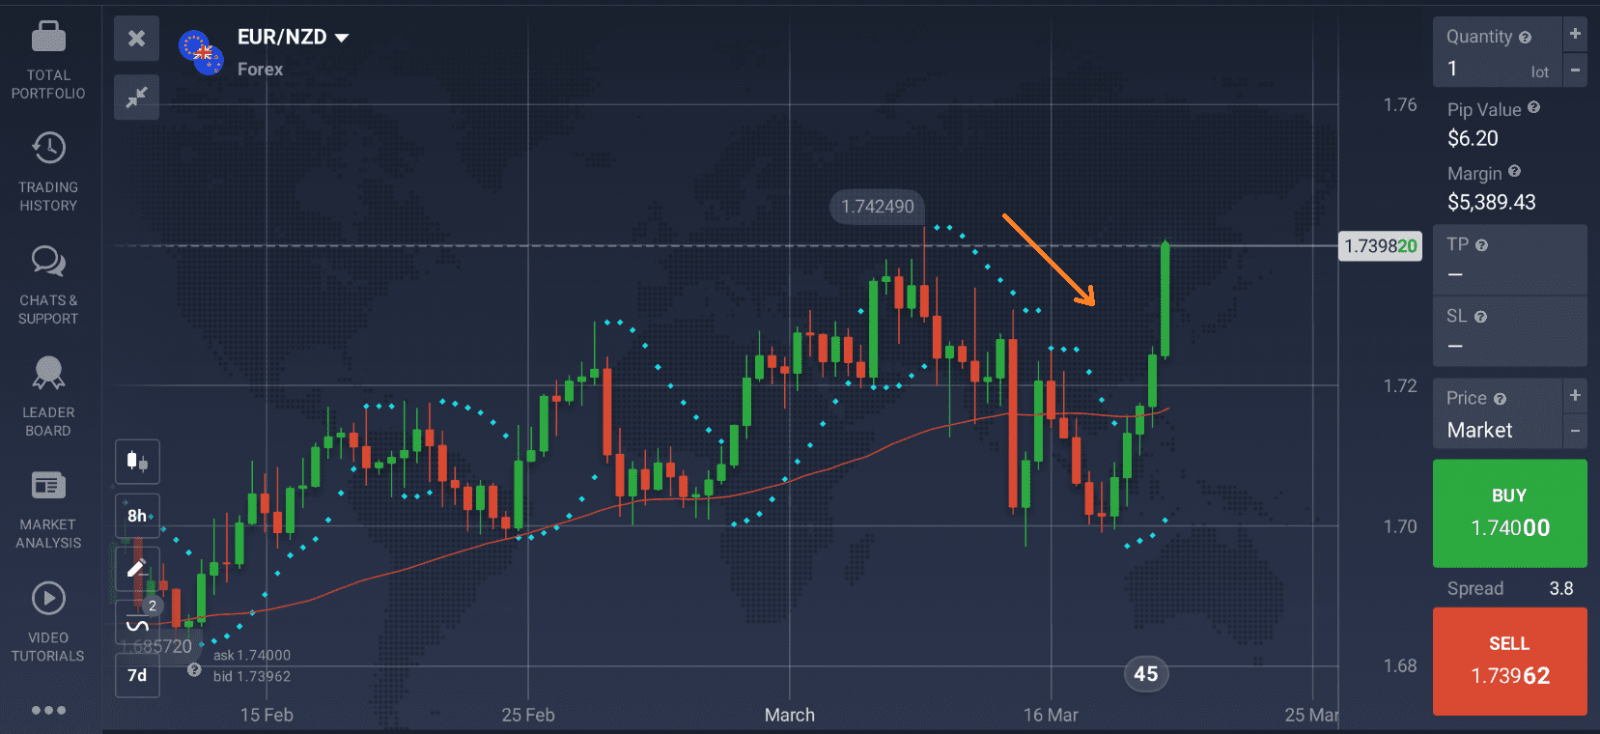
Anticipating a bearish trend
A bearish trend may be coming up if:
- The price is above the SMA line;
- The Parabolic SAR demonstrates downward movement.
It is worth noting that no indicator can guarantee accurate signals 100% of the time. Occasionally, all indicators will provide false signals, and Parabolic SAR is not an exception. However, once you have gained more experience and learned how to use Parabolic SAR indicator effectively, you may enhance your trading approach and achieve positive results.


