
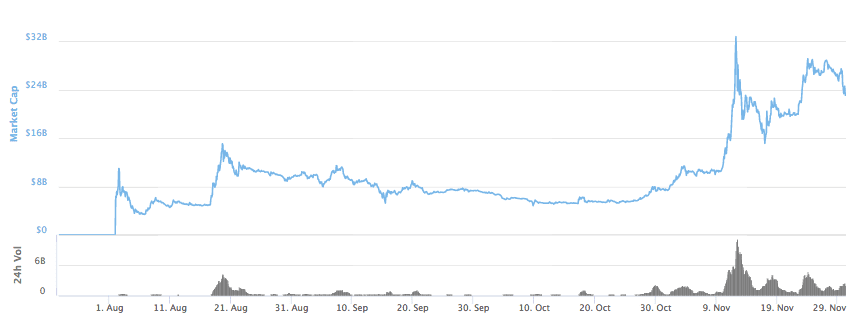
After the cancellation of the Segwit2x, the first hard fork of Bitcoin, Bitcoin Cash, took a massive leap and caught the attention of everyone. But unlike most of the coins available today in the market, Bitcoin Cash didn’t perform so well this week. With over $23 billion in market cap, the token is the third largest coin on the market today, without any contender hovering around it.
Key Highlights
- Against USD, BCH is on a bearish run and is struggling to find support around $1325
- BCH/BTC value dropped 66 percent week-on-week with the current value at 0.13 BTC
Considering the weekly chart first, the week start with an upward boost as the value went up from $1480 to $1738. But quickly it took a downturn. For a while, the coin oscillated between $1617 and $1548 before the value shot up to $1716 with a buying rage. But from there a downward momentum took over. Though in the midway, a sudden spike took the price from $1435 to $1564, because of the strong trend resistance it went down to $1302 quickly.
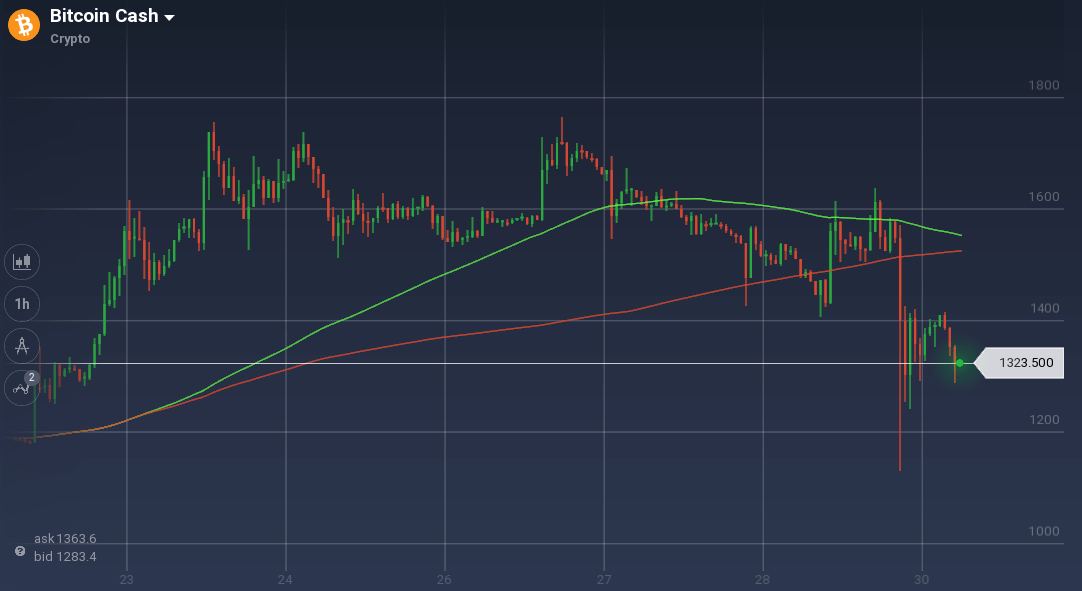
In the daily chart, the token is struggling to find a support level to stabilize. It depreciated 13.8 percent in the last 24 hours and is currently trading around $1336.
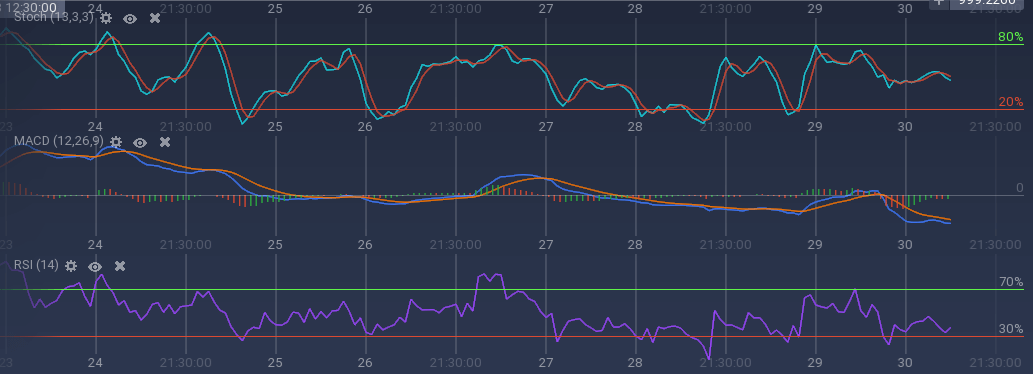
All the technical indicators are signaling a bullish trend. Stoch is on a downward path around 50 percent, and RSI is at 36 percent after touching the 30 percent overselling mark. MACD is also moving bearish below the axis. Due to the bearish run, 100SMA is also approaching 200 SMA fro a crossover.
Against Bitcoin, its fork Bitcoin Cash followed a weeklong strong bearish trend. BCH/BTC pair went down from 0.19 BTC to 0.13 BTC. This is a 66 percent weekly deprecation.