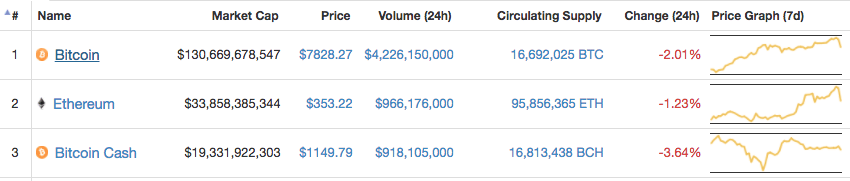
After the cancellation of SegWit2x, disappointed investors were pulling their money and we saw a huge drop in the value of Bitcoin and a surprising rise in the Bitcoin Cash value. But soon Bitcoin value stabilized and this past week the coin gained an incredible upward pace. Also, the digital token recorded a new high after going beyond $8000 mark. Also with this bull, the market cap of the coin went beyond $130 billion.
Key Highlights:
- The bullish coin touched $8000 for the first time but without stopping at that level it went up to $8260
- Though the token faced many resistance levels in the bullish journey consecutive support levels also formed
- Bitcoin is testing the $8000 level resistance again and hopefully will breach it
Jumping into the weekly chart, the growth is gradual and steep in the early week. Even though after the early week boost, the coin faced resistance $6700 and became stagnant, ultimately it breached the resistance without any dip. After gaining the upward pace again, the coin jumped from $6600 and touched $8000 for the first time in mere 36 hours. But as usual, the token faced resistance at the peak and took a downturn. After a dip to $7450, it found a support and that level also acted as a pivot.
In its bullish journey, the coin again faced resistance at different levels, but new support levels formed as well.
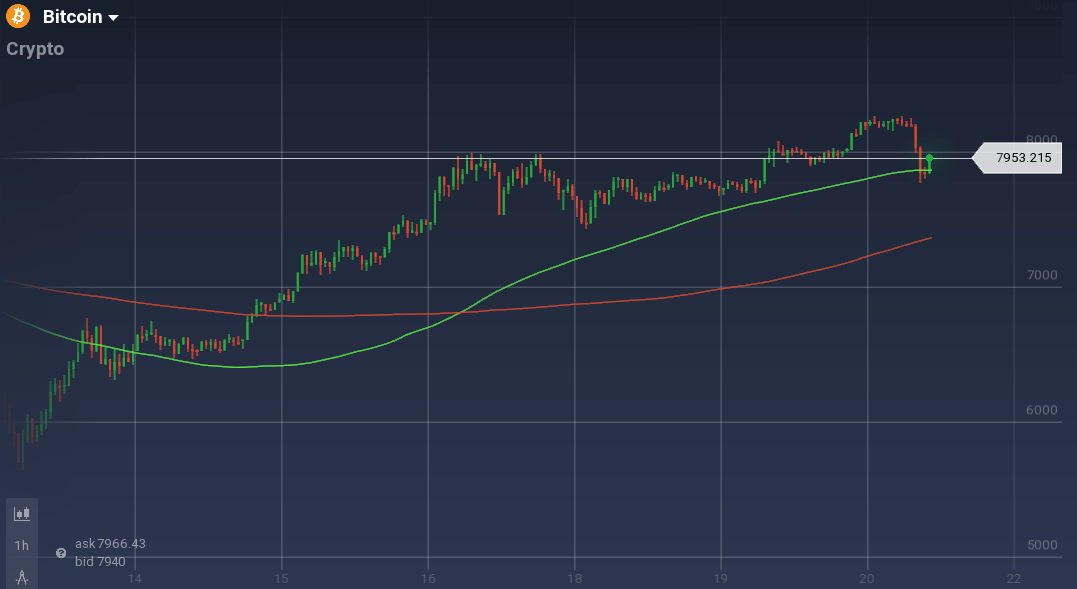
Considering the daily chart, the coin finally breached the $8000 resistance with a rage among the buyers and went up to $8260. But again, it faced another resistance at that peak. Though the token tried to hold the value and tested the resistance level for a while, it finally took a dive $7800. Currently, the new support level is holding the coin and pushing it back to recover.
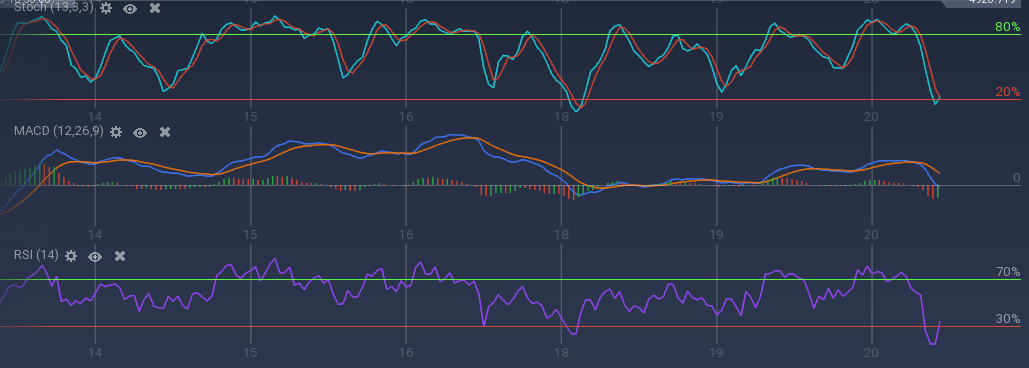
The recent drop in the value forced the technical indicators to take a bearish turn. But also because of the support level, signs of recovery can be seen. Stoch is taking a U-turn after dropping to the overselling mark. Similarly, RSI is also moving up after touching 13 percent. 100 SMA is also above 200 SMA indicating the least resistance to be upward.
Bitcoin faced a lot of criticism for many eminent personalities, mostly bankers. But still, the coin continued to prove itself and is also gaining a huge popularity in the society.