Most professional traders agree that Forex requires setting up stop-loss and profit targets, which can be even more important than the entry point itself. Due to the fact that currency pairs tend to move within well established support and resistance targets, useful stop-losses and profit-taking targets can be found within those ranges.
The basis for this technique is to use stochastic for trend following entries. The trends may be near, short or long term depending on your style, the time frames you like to work with and the entry points you find. The key is that you want to trade bullishly when prices are moving up and bearishly when prices are moving down.
Entry techniques
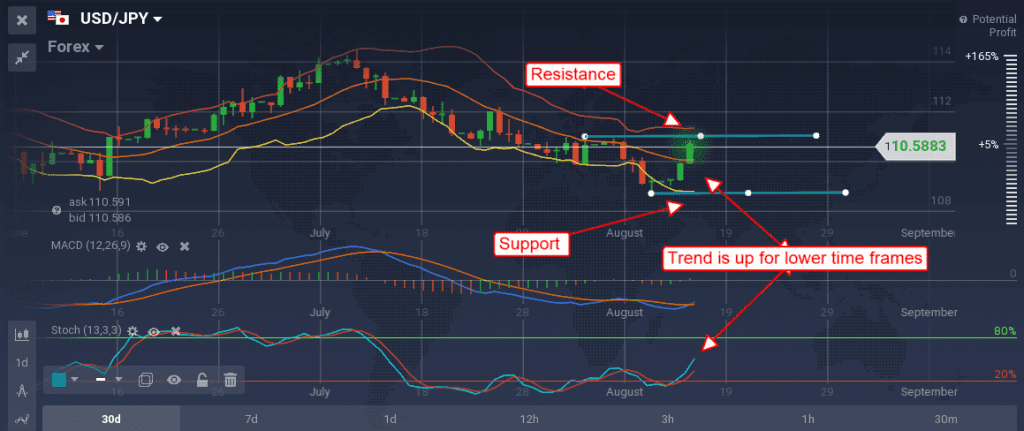
To find an entry, begin with the daily chart and draw key support and resistance lines. The two lines closest to the asset price are the ones you wish to focus on. Next, move down to the hourly chart and see if there are additional support/resistance lines you could draw that are within the longer term lines drawn on the daily chart. Having done this, move down to a 30 minute, 10 minute or 5 minute chart, whatever your preference is, and try to find whether even nearer term support and resistance levels are present.
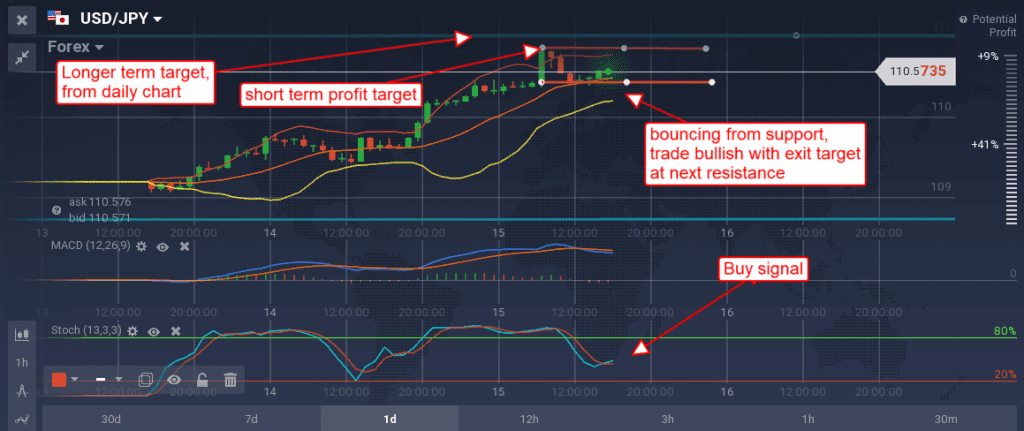
As reference, take a moment to study the following charts. Notice how the stochastic oscillator (bottom) compliments resistance and support lines by providing buy/sell signals. Also, pay attention to the differences between the daily chart and the hourly chart.


Signals come when the price action crosses a support or resistance line or confirms support or resistance at one of your lines. To weed out false and weak entries, apply the trend following rule as well, that is, only take entries that are in line with the trend. For example, if prices are trending higher, they might dip below a line briefly while testing it for support. The cross below would be a false signal, and the cross back above would be the good signal. Learning how to identify false signals is a skill that is sure to pay off in the long run.
In terms of strength and duration, you might expect to hold a position depending on which line it is you are trading from. A support/resistance line drawn on the 5 minute or 1 hour chart will not produce the same effect as a line drawn on the daily chart.
The daily charts are by far the strongest signals and may lead to movements lasting days, weeks, or even months. The hourly charts are in the middle and may produce the same strong signal as the daily chart, but they are more likely to produce a movement lasting a few hours, days or weeks at best. Shorter time frames are weaker and will provide less lasting movements. As always, keep an eye out for breakouts when working with support and resistance.
How to read profits
Profit taking targets are the next higher or lower support or resistance line. If the trade is bullish and prices are moving higher from a support line, the next resistance target is your profit target. When prices reach that level, or if they begin to show signs of topping while near it, it is advisable that profits be taken. The stop-loss function can be set initially at -5% of your position. This will give the asset some wiggle room before making its move higher and will not damage accounts if triggered.
As you embark on your next move, keep in mind that the IQ Option platform allows you to set a target profit as well which can be put before you open the deal. However, savvy traders will close once they have reached a specified price target like support or resistance. Using support and resistance lines is a great way to enhance your trading experience. The more you work on your trading skills and techniques, the greater you increase your chances of catching a big break. Why not give stochastic a try?

