The US Personal Income and Spending came in exactly as expected and failed to move the dollar significantly. The income data shows a 0.3% increase in earnings, driven by rising wages and declining unemployment, while spending increased by a slightly stronger 0.4%. While spending, an important metric for the economy, held steady from the previous month the income figure fell a tenth and raises a couple of questions.
The first, is wage growth slowing, is likely answered with a no. Labor markets are tight and tightening, employees are scare, and businesses are using wages to attract and retain their workers. The second, will lower wages have an effect on inflation and the FOMC rate-hike timeline is best answered with a maybe. Slowing wage growth may curb spending and economic activity enough to contain inflation growth but it’s just too soon to tell.
On the inflation front the PCE Price Index, a gauge of prices paid by consumers, rose by a tepid 0.1% and as expected. Also expected was a 0.2% increase at the core level and increases in YOY inflation that traders need to be wary of. Headline inflation rose a tenth to 2.3% and core a tenth to 1.9% and both as expected but both also in a range where FOMC rate hikes should be expected, the real question now is how many to expect?
Jerome Powell, the FOMC chair, has suggested a slowing of the Fed’s rate hike timeline. This means they see inflation contained, or nearly contained, and will be highly sensitive to data in the coming month. According to the CME’s FedWatch Tool the market still expects a rate hike at the next meeting with a 96% probability. This is down a bit from the previous day but has not showed “slowing” in the outlook. Looking forward the market is also still expecting to see a fourth hike by December.

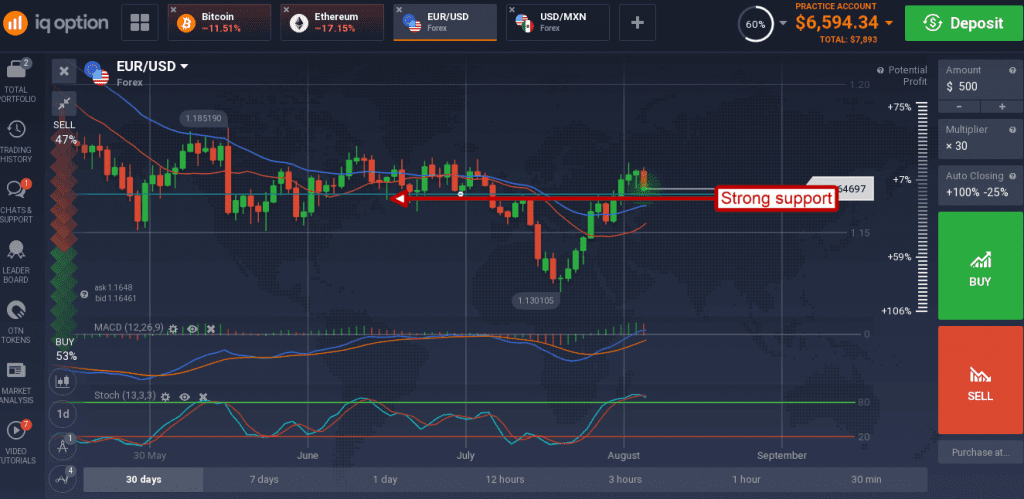
The EUR/USD edged down on the news but did not make a strong move. The pair has moved down to test support at the 1.16500 level and may move lower if EU data continues to come in weak. The next important data point from the EU will be Friday’s CPI which is expected to hold steady near 1.1%. If the pair does move lower from here it would take a move below 1.1580 to get bearish on prices and even that would still be above the short-term 30 day moving average. The indicators are weakening with today’s data which suggest a test of support should be expected, the caveat is that they are also consistent with the existence of support so a move below the EMA is not expected.

