

What is Market Sentiment?
Definitions: What Market Sentiment Means in Trading
Market sentiment refers to the aggregate attitude — optimistic (bullish) or pessimistic (bearish) — of all market participants toward a specific asset or market. It is influenced by news, economic events, trading results, and crowd psychology. Sentiment can fuel rapid rallies driven by greed or deep selloffs sparked by fear, often in ways that deviate from fundamental value.
While technical analysis focuses on price and patterns, and fundamental analysis evaluates intrinsic value, sentiment encapsulates the emotional response to both hard data and soft signals (rumors, headlines, and large-scale investor behavior).
👉 Read more on technical and fundamental analysis
Why Market Sentiment Matters
Trading decisions based solely on logic and data ignore the impact of collective mood swings. Recognizing points of excessive optimism or despair may alert traders to conditions ripe for corrections, rallies, or sudden volatility.
- Sharp swings in stock indices often follow periods of extreme sentiment
- Late-stage rallies can reflect herd mentality and overvaluation
- Market crashes often lead to overselling and potential contrarian setups
Market sentiment helps traders gauge when prices are moving on emotion versus data, improving timing and risk management.
Bullish and Bearish Sentiment in Different Instruments
Forex:
EUR/USD may rise when optimism increases around European economic data. Negative outlooks can trigger bearish sentiment and price declines.
👉 How to use economic calendars
Stocks:
Tech stocks like Nvidia often reflect bullish sentiment through rising volume and options activity. Bearish sentiment emerges during macroeconomic fears.
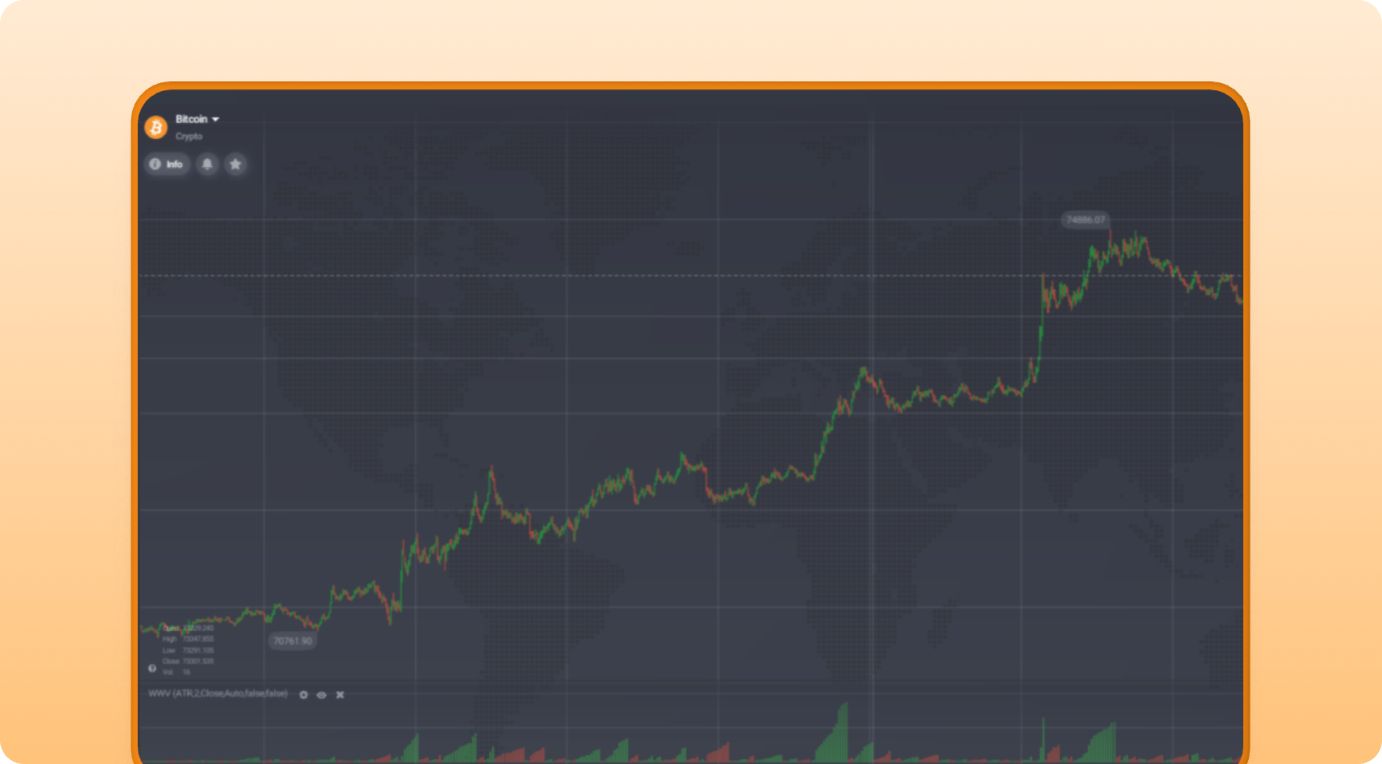
Cryptocurrencies:
Bitcoin strongly reflects sentiment shifts. Positive news fuels rallies, while regulatory concerns trigger sharp selloffs.
Recognizing Sentiment on Charts
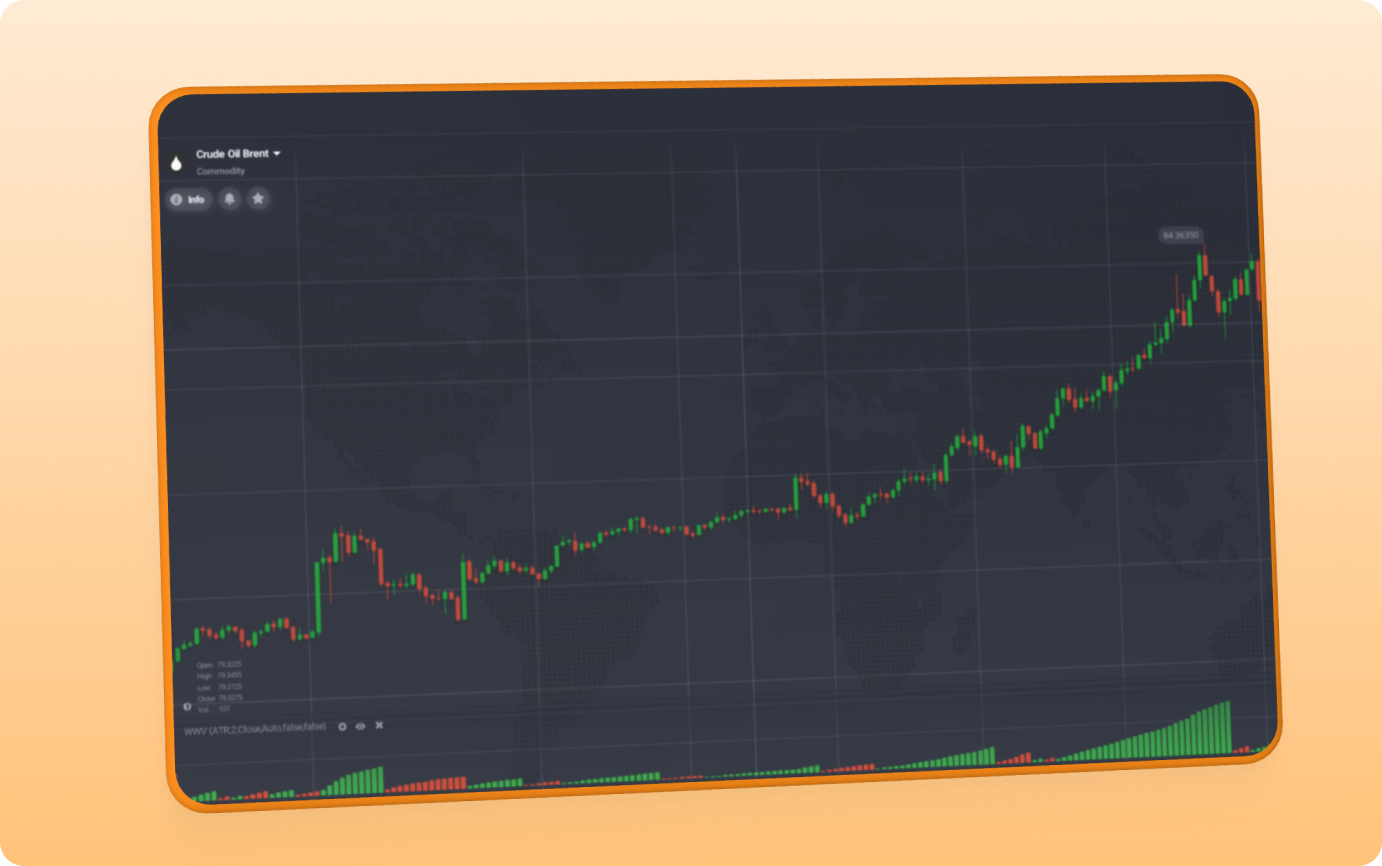
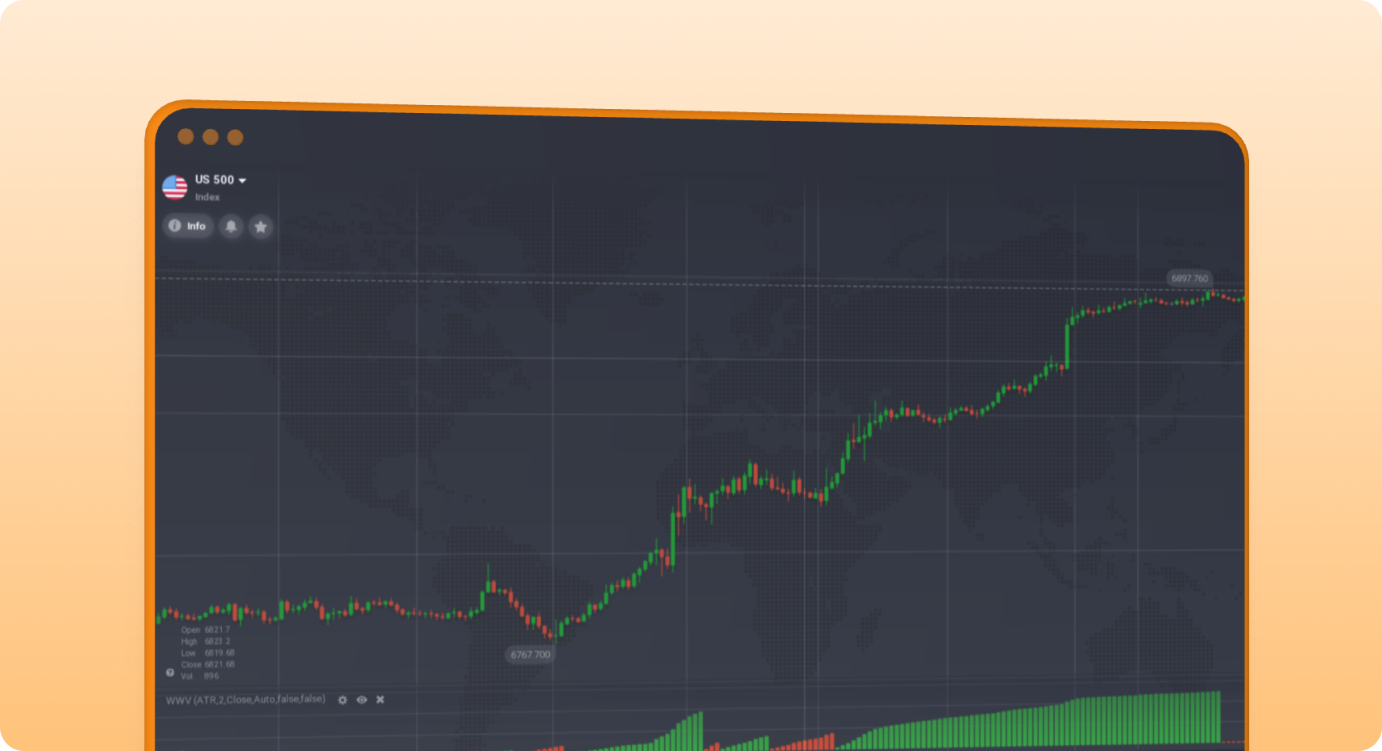
Bullish Signals:
- Higher highs with strong green candles
- Rising volume
- Increased call option activity
- Positive news and social sentiment
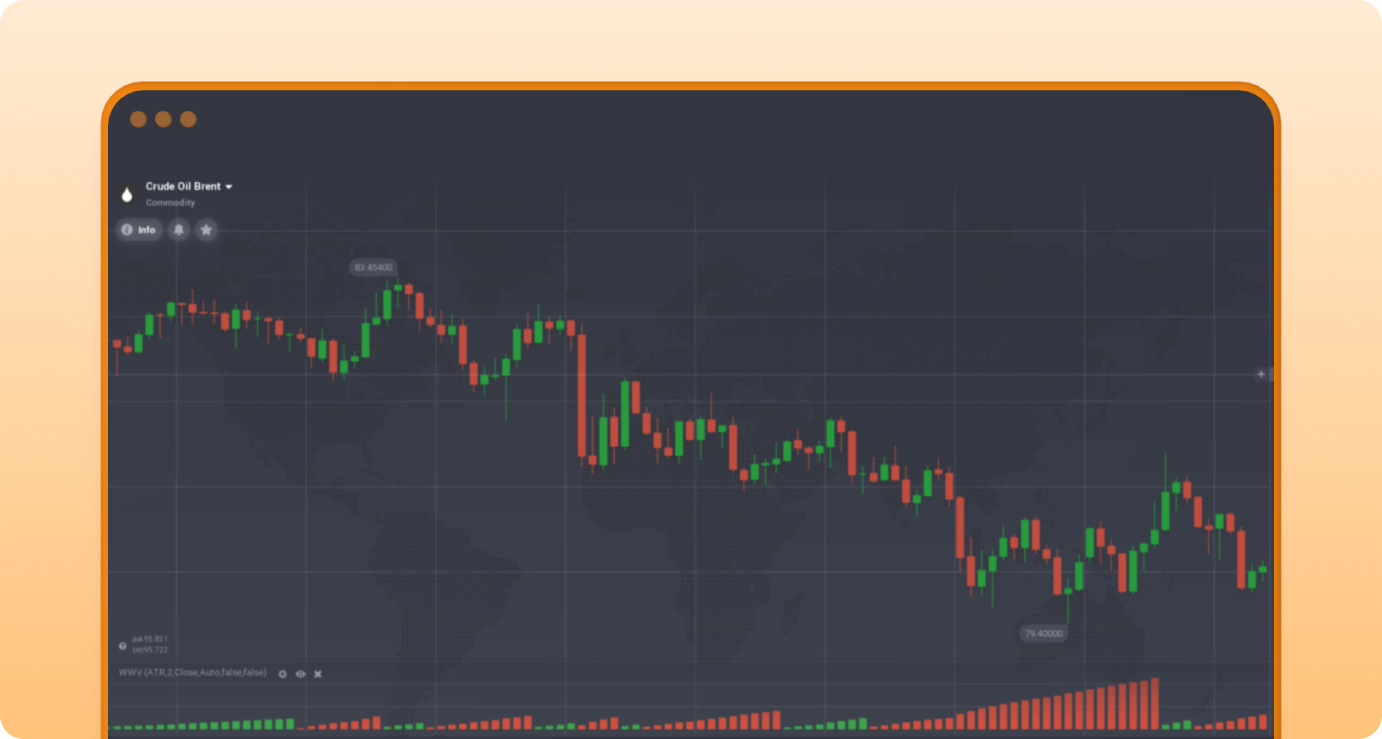
Bearish Signals:
- Sharp drops with red candles
- Rising selling volume
- Put/call ratio above 1
- Negative news flow
Note: Sentiment should never be used as a standalone trading signal.
Core Tools for Measuring Market Sentiment
Effective sentiment analysis requires combining multiple tools with disciplined risk management.
Sentiment Indicators: COT Reports, Put/Call Ratios
COT Reports (Commitment of Traders):
- Weekly reports showing positions by trader groups
- Useful for identifying institutional vs retail positioning
- Can signal potential reversals
Put/Call Ratio:
- Measures bearish vs bullish options activity
- Above 1 = bearish sentiment
- Below 1 = bullish sentiment
Interpretation requires context. Extreme readings can indicate turning points rather than trend continuation.
Volume and Order Flow Analysis
Volume Spikes:
Confirm strength behind price movements
Delta and Order Flow:
Shows buying vs selling pressure
Liquidity Zones:
Key areas where large trading activity occurs
Volume helps confirm whether sentiment is backed by real capital.
AI-Powered and Real-Time Tools
AI Sentiment Analytics:
Processes news, social media, and transactions to assess sentiment quickly
Real-Time Dashboards:
Provide heatmaps and sentiment indicators for live decision-making
These tools are especially useful during high-impact events.
Comparison Table: Sentiment Tools for Traders in 2026
| Tool | Examples | Best Use | 2026 Strength |
| COT / Put-Call Ratio | Reports, options data | Contrarian signals | Real-time updates |
| Volume & Order Flow | Volume spikes, delta | Confirmation and reversals | Handles volatility |
| AI Sentiment | News, social data | Fast sentiment tracking | Expanded data coverage |
| Dashboards | Heatmaps, sentiment bars | Visual decision-making | Cross-market live views |
Tip: Always combine sentiment, volume, and price for stronger signals.
Advanced Techniques for 2026
Markets are increasingly influenced by AI and algorithmic trading, making advanced techniques essential.
Integrating Sentiment with Price Action and Liquidity
Steps:
- Mark key support/resistance levels
- Overlay sentiment data
- Confirm with volume/order flow
- Enter trades when signals align
- Place stops beyond liquidity zones
This approach filters out low-quality signals.
AI Integration and Volatility
AI tools can quickly detect sentiment changes during:
- Earnings releases
- Central bank announcements
- Regulatory updates
Use AI insights alongside price confirmation—not alone.
Impact of Algorithmic Trading
- Algorithms react to sentiment instantly
- Can amplify volatility
- May trigger rapid cascades
Stay effective by combining AI speed with human judgment.
Practical Steps to Analyze Sentiment Daily
Daily Sentiment Analysis Routine
Pre-Market:
- Review news and economic events
- Check sentiment indicators
- Mark key price levels
During Market:
- Monitor volume and order flow
- Watch sentiment alignment
- Set alerts at key zones
Post-Market:
- Compare sentiment vs price action
- Update watchlists
Common Pitfalls and Best Practices
Common Mistakes
- Ignoring volume confirmation
- Over-relying on algorithms
- Emotional trading
- Using sentiment alone
Best Practice Checklist
- Confirm signals across multiple tools
- Align sentiment with price and volume
- Use stop-loss near liquidity zones
- Test strategies on demo accounts
- Keep risk per trade low
Real-World Examples
Stock Rally Example
During Nvidia’s major rally:
- Sentiment turned extremely bullish
- Call options surged
- Price reversed after high-volume indecision candles

Cryptocurrency Breakout Example
Bitcoin breakout above $80,000:
- Strong bullish sentiment
- Volume concentrated at key zones
- Order flow confirmed entry
Contrarian Example
At an S&P 500 peak:
- Extreme bullish sentiment
- Low put/call ratio
- Reversal followed
Final Thoughts
Market sentiment is a powerful tool when combined with technical and fundamental analysis. Use it as part of a structured, risk-aware strategy—not in isolation.
To improve your results:
- Stay informed
- Test strategies
- Use disciplined risk management
Sentiment analysis can provide an edge—but only when applied carefully, consistently, and with proper risk control.