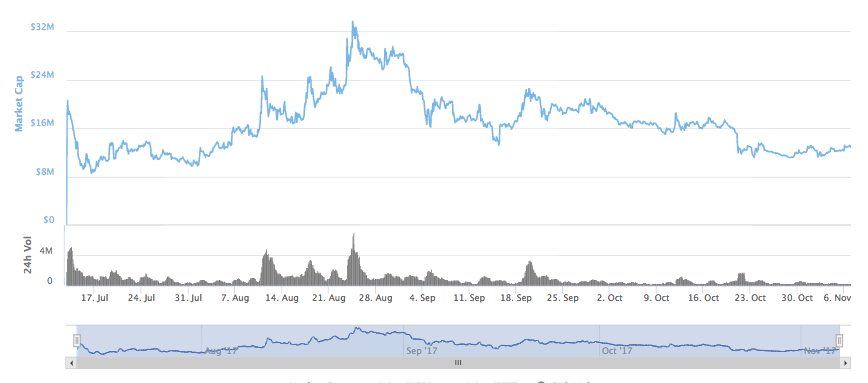
Santiment was introduced as the financial information provider of all the cryptocurrencies. With an aim to be the Bloomberg of the crypto-space, the new coin gained popularity very fast. With its introduction in July’17, the market gave it a good welcome.
Within a month, the market cap of Santiment almost doubled and reached above $32 million. But then like many cryptos, a downward rally began, and SAN is left with only above $12 million in the market cap.
Santiment had a lot of activity on the market this week. An upward rally in the early week resulted in a 15% surge in mere 24 hours taking the value from $0.20 to $0.23. But resistance at that mark halted the growth and resulted in a steep dip in the value. But the support level at $0.19 to $0.20 checked any further depreciation. $0.20 mark also acted as a pivot and is followed by an upward rally. But because of a new resistance at $0.23, the value stabilized and fluctuated within a narrow band between $0.22 and $0.23. A second downward dip in the week took the price to $21 where SAN/USD pair received a support level.
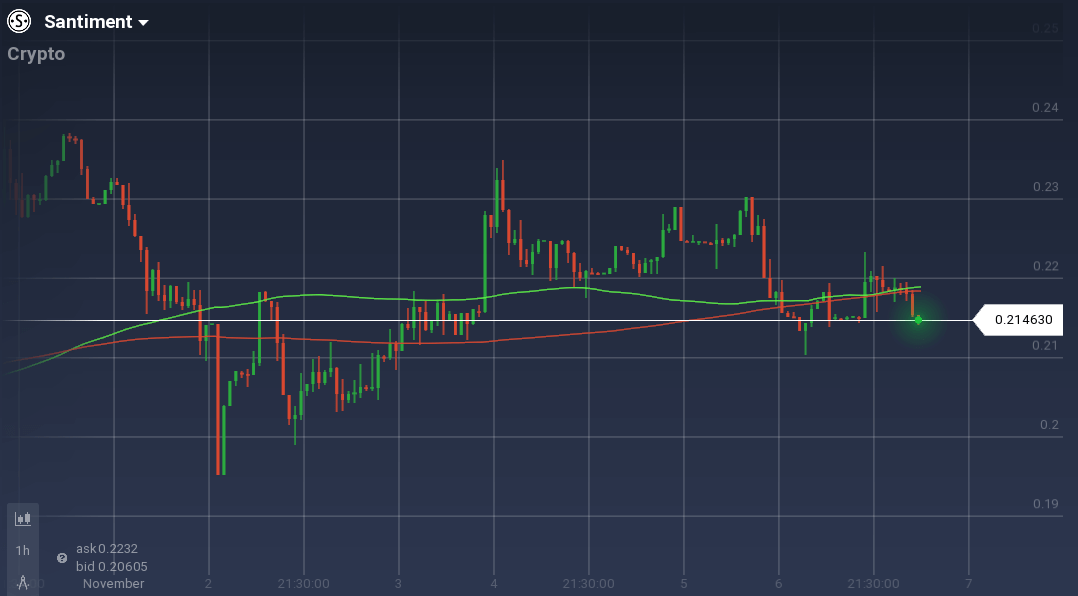
In the daily chart, the SAN/USD pair is mostly fluctuating between $21 and $22. But recently another downward movement can be observed.
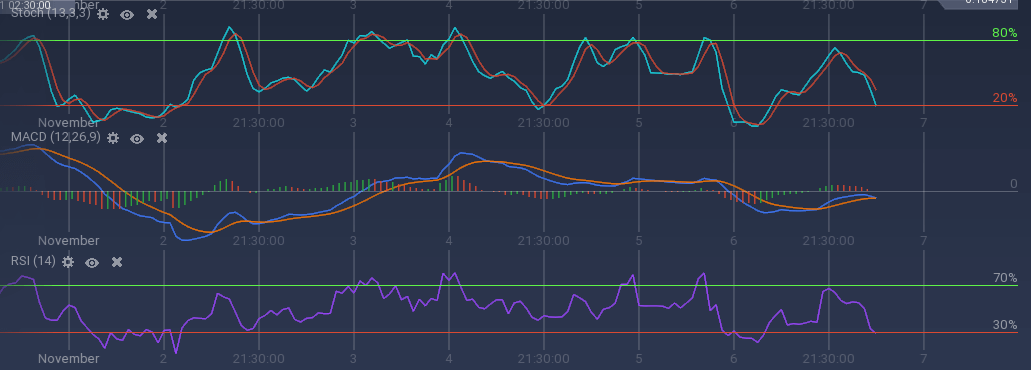
Considering the oscillators, both Stoch and RSI are nearing the overselling zone. MACD is also running bearish with a possibility of a crossover.
Against Bitcoin, SAN depreciated more than 16% over the week. The support level at 0.000029 helped in stabilizing the value after the steep dip, and the pair is currently trading at 0.000030 BTC.