RSI (Relative Strength Index) is an effective indicator that is widely used by both novice and experienced traders. Why is it so popular? Well, first of all, it is the indicator’s simplicity of design – it is easy to understand once you learn how to use it. Another great thing about RSI is that it can be combined with multiple other indicators and support different trading approaches. Today we will look at the RSI and MACD strategy combined with a Simple Moving Average for a method that works both on short and long timeframes.
Relative Strength Index
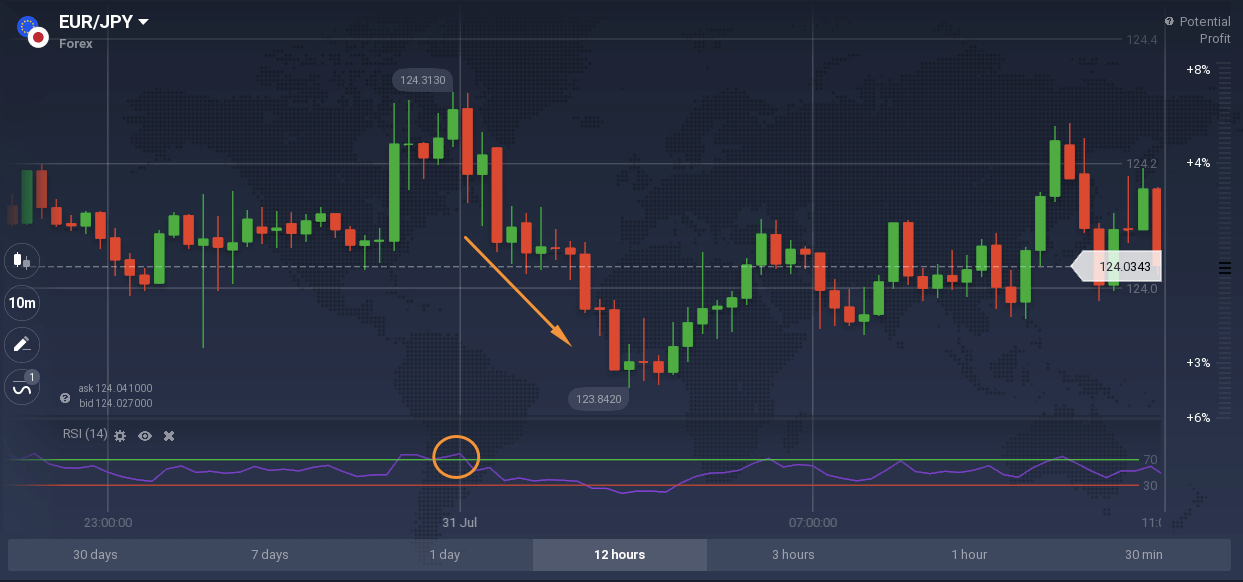
The RSI indicator is used to measure the strength of the trend and find potential reversal points. It consists of a baseline of 14 period and two levels: overbought and oversold.
These levels are set at 30 and 70 or 20 and 80, depending on the trader’s approach. Setting the indicator at 20 and 80 is generally considered a more conservative approach. It makes the indicator less sensitive to price fluctuations and could potentially give stronger indications, however, it really depends on the trader’s preference.

With the RSI indicator, usually a Buy signal is received when the baseline reaches or crosses the oversold level and starts moving up, a Sell signal is received when the baseline reaches the overbought line and reverses downwards.
MACD + RSI + SMA strategy
So how to use MACD and RSI together with SMA? This combination is a trio of a leading and two lagging indicators.
- RSI is a leading oscillator, which means that it shows the potential future changes in the price.
- Simple Moving Average is a lagging, trend-following, indicator. RSI shows the possible reversal points and the SMA helps to confirm the signal.
- MACD shows the strength of the trend as well as its direction. In this approach, it is used to confirm the signals of the first two indicators.
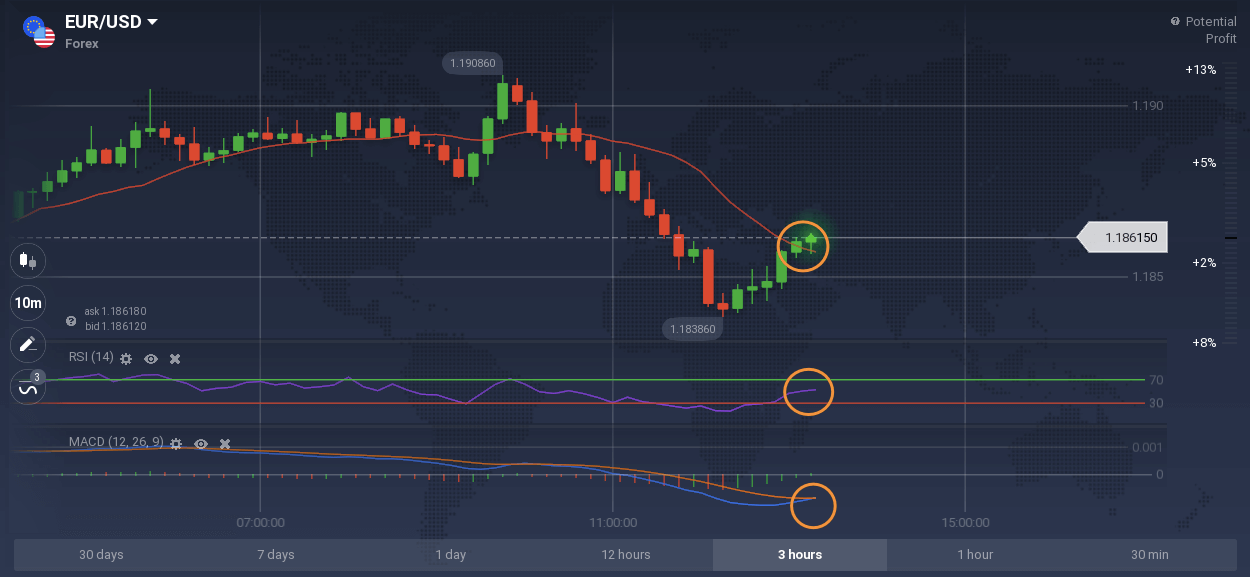
So, how to read MACD and RSI signals and use these indicators together? Let’s look at the example below to see them in action.
In this example, the baseline of the RSI indicator is above 50 and moving up. The candle chart is crossing the SMA line from below and moving above it, and the MACD indicator is also giving a Buying signal: the blue line is crossing the orange line upwards from below.

A Selling signal would be received if the candlesticks were moving under the SMA line, the RSI base line was moving towards the oversold level and the MACD was showing red bars with the blue line crossing the orange one downwards.
MACD + RSI + SMA strategy setup and configuration
To apply the three indicators, simply find them in the indicators’ menu on the platform. You may use the search field for it, or find the RSI and MACD in the Momentum section, and the Moving Averages in the Popular section.
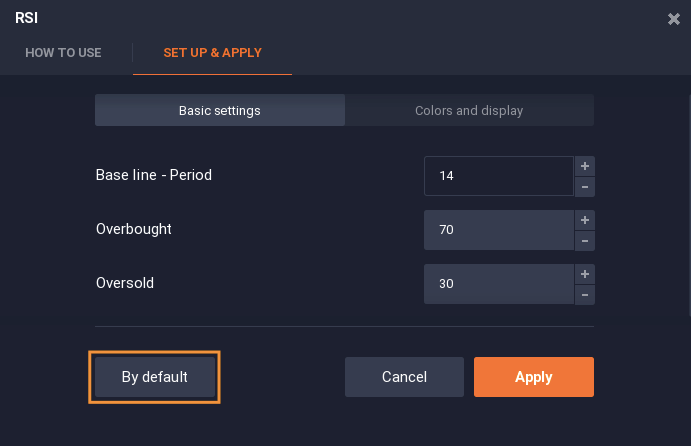
In the examples above, all the indicators are used with their default settings. However, more experienced traders may change the indicators’ settings according to their own needs.

For instance, a trader may change the overbought and oversold levels for RSI, the period for the SMA or the MACD periods. However, there is nothing wrong with using the indicators on their default settings.
Conclusion
RSI and MACD strategy combined with SMA may provide a trader with signals about the trend strength and reversal points. Still, there is no indicator or strategy that would guarantee 100% success. Trading is risky and therefore should be treated accordingly – traders need to practice and remember about risk management at all times.

