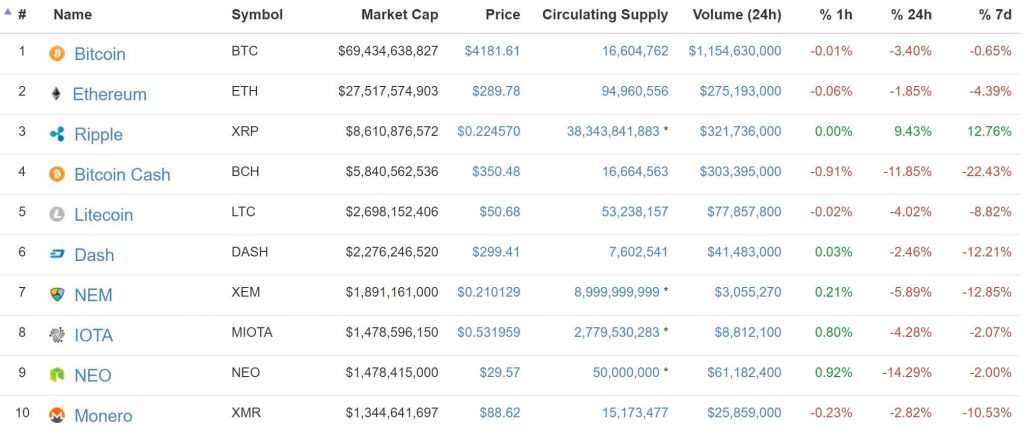
At the moment, Ripple (XRP) is the only cryptocurrency in the top-20 list to demonstrate positive growth in three major time categories: one hour, 24 hours and 7 days. The price of the third-largest cryptocurrency is consolidating, but will it make it past $0,23? What are the possibilities of trading Ripple and what should one expect from its price action in the coming hours and days?

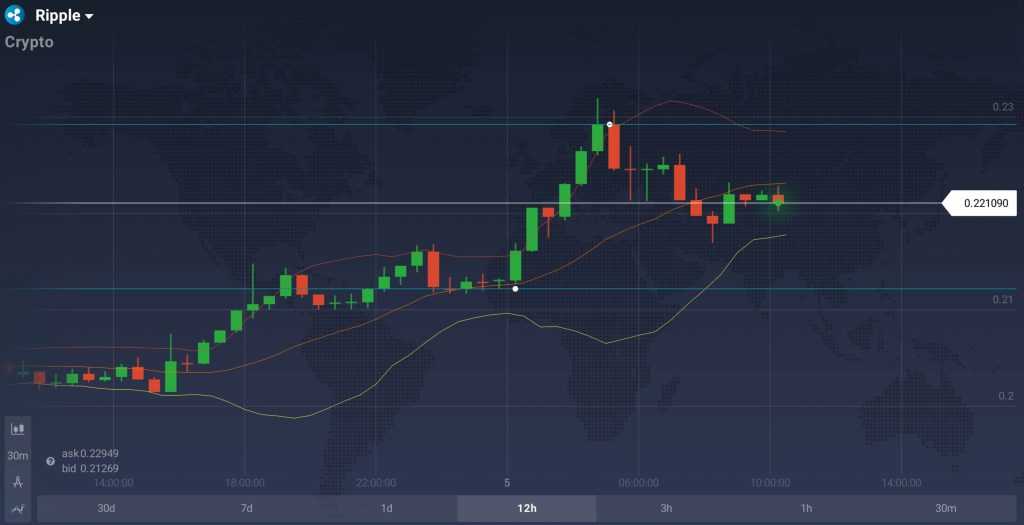
Support and resistance lines can be observed on $0,212 and $0,229 respectively. After a prolonged upward rally, initiated on October 3rd, the price action could have been seen approaching the resistance of $0,229 and retracing back in a matter of only one hour. Bollinger Bands, a technical analysis indicator used to define volatility and trend strength, hints at a presumably strong positive trend. The latter, however, can abruptly end, as demonstrated by the contracting outer lines. According to BB, longer periods of growth/decline are usually intermingled with shorter periods of consolidation, during which the trend can very well change its direction.

The nosedive, observed during the early morning hours today, can be both a short-lived retraction and a new negative trend. Average Directional Index (ADX), a tool that excels at determining positive and negative trend strength, points to diminishing power of the positive trend (that is now almost equal to the negative potential) and the overall consolidation.

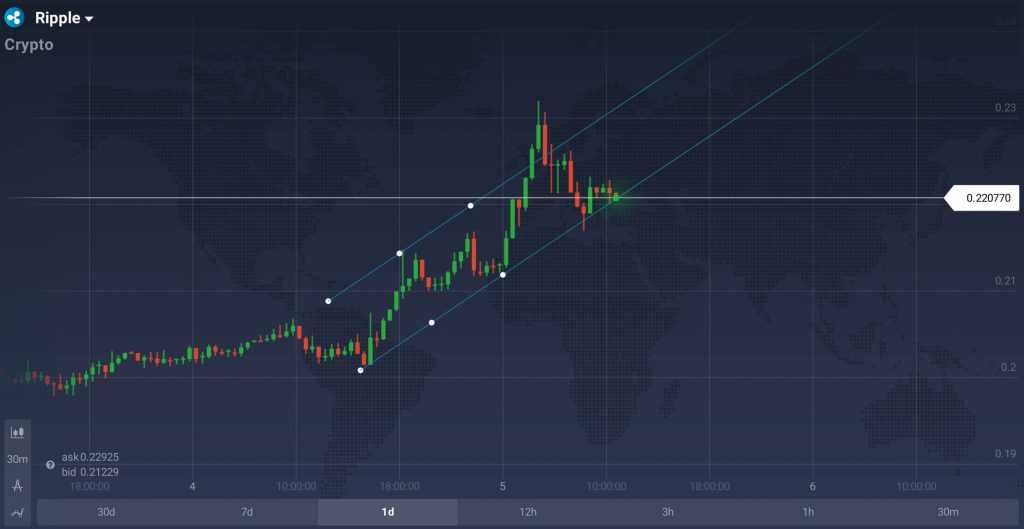
Certain experts believe that in order to confirm the bearish trend, XRP will have to depreciate even further and reach $0.188, the lowest price level since September 29th. The rising channel pattern has already been tested by a minor negative twitch and will most certainly be tested once again during the day.


