

140 new European stocks have just landed on IQ Option 🎉 Here are some names that deserve extra attention due to their volatility.
We picked 20 stocks where price action can get particularly interesting — from AI chipmakers and defense giants to fashion brands.
What makes a stock volatile?
Before we begin, an important point: volatility doesn’t tell you where a stock will go. It tells you how much it tends to move — or, simply put, how fast it’s changing its mind.
The major volatility triggers are earnings reports, new defense contracts, AI breakthroughs, weaker or stronger consumer demand, tariff announcements, etc. The bigger the surprise — and the more sensitive the stock — the bigger the potential reaction.
So where should traders look? Here are five volatility zones worth knowing.
What a EU stock trader must know
European stocks have their own rhythm. A few things are worth keeping on your radar:
- The open can be noisy. European stocks often react at the start of the session to news released overnight.
- Watch the US session. Europe may open first, but major US data and the Wall Street open can trigger a second wave of volatility, especially in globally exposed tech, industrial and luxury stocks.
- ECB days matter. Rate decisions, inflation data and comments from ECB officials can quickly move banks, real estate, consumer stocks and other rate-sensitive sectors.
- A sharp EUR move can change expectations for European exporters. A stronger euro can be a headwind for companies earning a large share of revenue abroad, while a weaker euro can work in their favor.
Europe’s 5 volatility hotspots
So where can that volatility show up? Here are five zones worth watching.
1. AI & chips
ASML · ASM International · BE Semiconductor (BESI) · STMicroelectronics
Few corners of the European stock market are producing moves this big this often. Just look at the past year:
ASML
1Y+84.9%
ASM International
1Y+70.3%
BESI
1Y+49.3%
23 Sep 2025 – 23 Sep 2026 · EUR
BESI’s and ASM’s trailing 1-year volatility is about 13%.
BESI & ASM International
1Y- BESI
- ASM
European tech as a whole has also been volatile: the F.A.Z. Euro Technologie Index recorded annualized volatility of roughly 20.4% over 360 days.
Europe’s AI story looks different
When people think AI, they usually think OpenAI, Anthropic or NVIDIA. Europe has fast-growing AI companies too — but many of its biggest AI names are still private.
For stock traders, some of Europe’s clearest AI exposure therefore sits one layer deeper: the companies building the technology behind the AI boom.
- ASML makes the machines used to manufacture advanced chips.
- ASM International supplies equipment used in chip production.
- BESI specializes in advanced chip assembly and packaging.
- STMicroelectronics makes chips used in cars, factories, data centers and other technology.
Why they move
European chip stocks have many potential triggers:
AI demand · chip cycles · high expectations · US–China tensions · export restrictions
Any one of them can be enough to move prices sharply. A good example is STMicroelectronics — in June 2026, the stock jumped 8.2% in one morning after the company doubled its data-center revenue target thanks to stronger AI demand.
STMicroelectronics NV
1YWhen several triggers hit at once, volatility can become even stronger.
What can trigger the next move?
- Global AI spending ↑ → more demand for advanced chips and equipment
- New AI models & data centers ↑ → chip investment may rise
- Export restrictions ↑ → European chipmakers may lose access to some markets
- Chip demand disappoints ↓ → expectations can reverse quickly
👀 Watch when: major AI companies announce new models or investment plans, NVIDIA and other chipmakers report earnings, or governments announce new chip and export policies.
2. Defense & geopolitics
Rheinmetall · Leonardo · Thales · MTU Aero Engines
Europe has been spending much more on defense in recent years. That means every new budget, military contract, or geopolitical headline can change expectations about how much business these companies could get. As a result, these stocks really are volatile.
For instance, Rheinmetall’s and Thales’ recent one-year volatility was around 20%.
Europe is rearming
For years, many European countries kept defense spending relatively low. That has changed. Non-US NATO members increased military spending by 20% in 2025, and European manufacturers are now racing to keep up with new orders.
That puts companies like Rheinmetall, Leonardo and Thales directly in the spotlight:
- Rheinmetall 🇩🇪 → ammunition, tanks, air defense
- Leonardo 🇮🇹 → helicopters, aircraft, electronics
- Thales 🇫🇷 → radar, missiles, cybersecurity
- MTU Aero Engines 🇩🇪 → military and commercial aircraft engines
What does that volatility look like?
Sometimes one geopolitical event moves the whole sector. A good example came in March 2026.
When the Middle East conflict escalated, European defense stocks initially jumped: Rheinmetall, Leonardo, Thales and other major names gained roughly 4–9% in a single morning.
Leonardo SpA
1YBut within days, several of the same stocks reversed direction as traders reacted to new geopolitical headlines and company news. Rheinmetall even dropped 8% in one session after its outlook disappointed investors.
That’s what makes defense stocks volatile: the story can change fast — and so can the price.
What can trigger the next move?
EU defense spending ↑ → more potential orders
Major contract won → individual stock may jump
Geopolitical tensions ↑ → defense stocks may react
Peace talks / ceasefire ↑ → sector can move the other way
Budgets disappoint ↓ → expected orders may be questioned
👀 Watch when: the EU or NATO announces new defense plans, European governments set military budgets, major contracts are awarded, or geopolitical headlines hit.
3. Growth & expectations
Adyen · Delivery Hero · Worldline · Zalando
These companies were stars of Europe’s digital boom, as e-commerce, food delivery and digital payments exploded. Back then, fast growth was often enough to excite investors. Today, traders also want to see profits, healthy margins and cash flow — growth that actually makes money.
Expectations can move prices fast
Just look at Adyen. In August 2026, the Dutch fintech reported 21% constant-currency revenue growth and raised its full-year growth forecast to 21–23%. Investors liked what they saw: Adyen jumped around 16% in one day.
Adyen NV
3MZalando shows the other side of the same story. Its Q2 adjusted profit grew 10%, but the company said sales and GMV were now expected in the lower half of its previous full-year range.
In August 2026, the German retailer reported 20.8% revenue growth and a 10% rise in adjusted profit — but sales came in below expectations and Zalando lowered its growth outlook. The stock plunged as much as 18% in one day.
Zalando SE
3MWhy they move
Revenue beats expectations ↑ → growth story gets stronger
Profitability improves ↑ → investors may become more confident
Guidance disappoints ↓ → expectations can fall quickly
Turnaround works ↑ → market may reprice the company
💡 Tip: Do not look at the results alone — check whether they were better or worse than traders expected.
What can trigger the next move? 👀
- Earnings reports → actual numbers meet expectations
- New guidance → company tells us what it expects next
- Margins & cash flow → growth is becoming more profitable — or not
- Restructuring plans → turnaround may speed up or fail
👀 Watch when: these companies report earnings, change their forecasts, announce cost cuts or update profitability targets.
4. Consumer mood
Puma · Hugo Boss · Kering · LVMH
These stocks are sensitive to how consumers feel about spending. Inflation, interest rates, confidence and economic growth can change demand — and quickly change what investors expect from consumer brands.
And we can see it in the numbers. The Puma stock fell from around €30 in late July to about €21.5 by mid-September — a drop of roughly 28%. The decline came as investors faced weaker demand, falling sales and uncertainty around Puma’s turnaround.
Puma SE
3MOn July 29, Kering jumped 16.9% in one day — its biggest daily gain since 2002. The catalyst was better-than-expected Q2 results, especially at Gucci. Gucci generated about €1.4 billion in sales, above the €1.37 billion expected, while strong U.S. demand for new handbags helped improve the outlook for the brand’s turnaround.
Kering SA
3MWhat can trigger the next move?
- Consumer confidence ↑ → people may spend more
- Inflation / rates ↑ → shoppers may cut non-essential purchases
- China / US demand ↑ → fashion and luxury may benefit
- Weak sales or guidance ↓ → stock can react quickly
👀 Watch when: Europe releases inflation, retail-sales or consumer-confidence data; China and the US publish major consumer updates; or these companies report earnings.
5. The industrial cycle
Siemens Energy · Alstom · Wacker Chemie · Sartorius
Industrial stocks may sound boring — but not their charts. Just look at the recent moves:
- Siemens Energy (power & grids): ~€136 → €166 → €132. That’s about +22% and then −20%.
- Sartorius (biopharma equipment): ~€210 → €255 → €230. Several swings of roughly 15–20%.
- Wacker Chemie (chemicals & materials): ~€82 → €97 → €86. Repeated 7–18% swings.
- Alstom (trains & railways): ~€15 → €17 → €15.5. Smaller, but still repeated ~7–13% swings.
These companies operate in very different industries, but they have something in common: their future business depends heavily on what happens next.
Will Europe build more power infrastructure? Will factories produce more? Will energy become more expensive? Will governments spend more on rail? Will biotech companies order more laboratory equipment?
When the answers change, expectations change — and so can the stock price.
Why they move
- More orders → future revenue expectations ↑
- Infrastructure spending ↑ → Siemens Energy and Alstom may benefit
- Energy costs ↑ → Wacker Chemie’s margins can come under pressure
- Biopharma investment ↑ → Sartorius may see stronger demand
- Economic slowdown → industrial expectations ↓
👀 Watch when: companies report orders and earnings, Europe releases industrial data, governments announce infrastructure projects, or energy prices move sharply.
Europe’s Volatile 20 at a glance
| Stock | Sector | Main volatility driver |
| ASML | Semiconductors | AI demand + export rules |
| ASM International | Semiconductors | Chip capex + earnings |
| BESI | Semiconductors | AI + chip cycle |
| STMicroelectronics | Semiconductors | Autos + chips + industrial demand |
| Rheinmetall | Defense | Geopolitics + defense budgets |
| Leonardo | Defense | Contracts + geopolitics |
| Thales | Defense | Defense spending + contracts |
| MTU Aero Engines | Aerospace | Aviation + defense demand |
| Adyen | Fintech | Growth + earnings |
| Delivery Hero | Delivery/tech | Profitability + guidance |
| Worldline | Payments | Turnaround + company news |
| Zalando | E-commerce | Consumer demand + margins |
| Puma | Fashion | Consumer demand + guidance |
| Hugo Boss | Fashion | Consumer demand + China |
| Kering | Luxury | Gucci turnaround + luxury demand |
| LVMH | Luxury | Consumer demand + China + luxury spending |
| Siemens Energy | Energy/industrial | Power demand + orders |
| Alstom | Industrial | Contracts + debt + orders |
| Wacker Chemie | Chemicals | Energy costs + industrial cycle |
| Sartorius | Healthcare | Biopharma demand + orders |
How to actually trade volatility
Volatility is useful only if you know what is causing it and how to react.
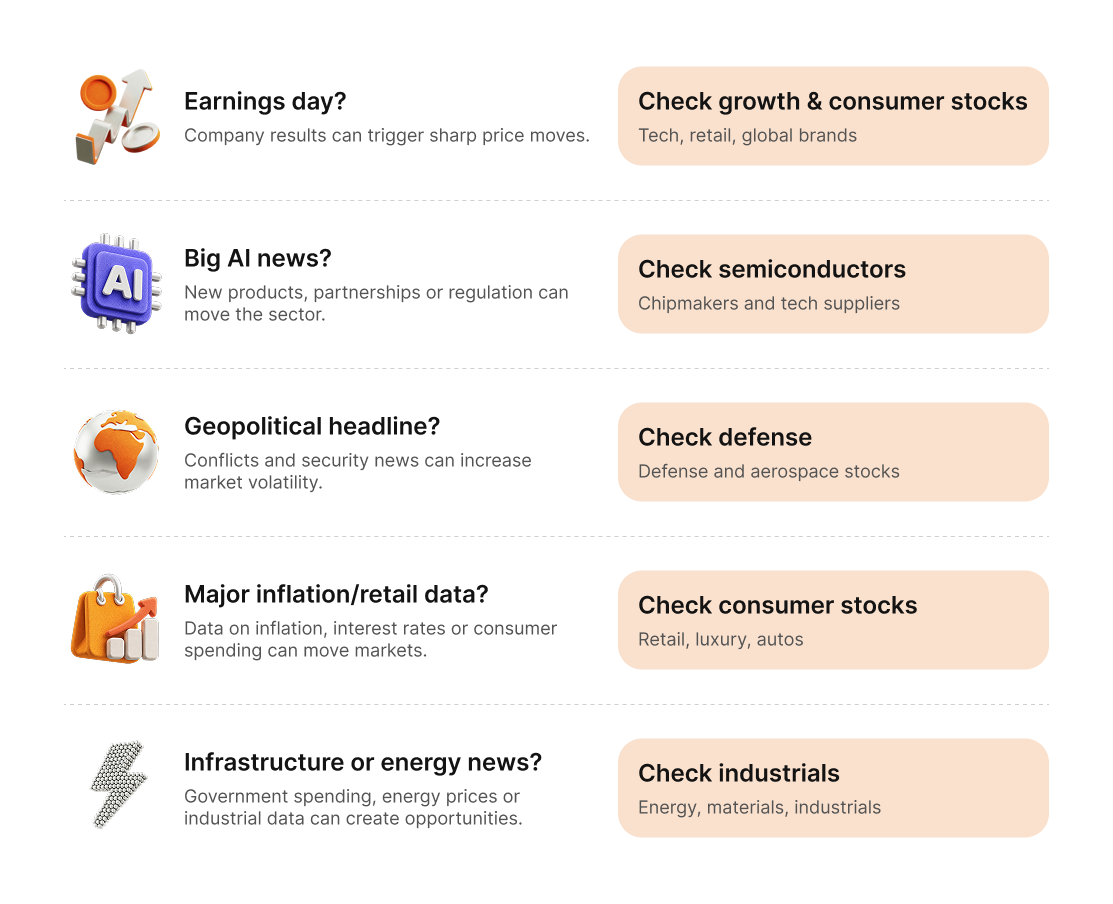
Then check the chart:
- Is the price already trending?
- Is it approaching support or resistance?
- Has volatility already exploded, or is the market still waiting for the catalyst?
Want to go deeper?
Explore more articles:
👉 What Is Volatility? Meaning, Indicators, and Trading Strategies
👉 What Are Bollinger Bands and How Do They Work?
👉 ATR Stop-Loss Calculator: How Far Should Your Stop Be?
Final thoughts
With 140 new European stocks now available, there’s a lot more to trade — but you don’t need to watch them all.
The idea behind Europe’s Volatile 20 is: know where bigger moves are more likely to happen, then wait for a reason to trade them.
And remember: volatility works both ways. Bigger potential moves also mean bigger risk, so manage your position accordingly.
Ready to explore beyond the 20?