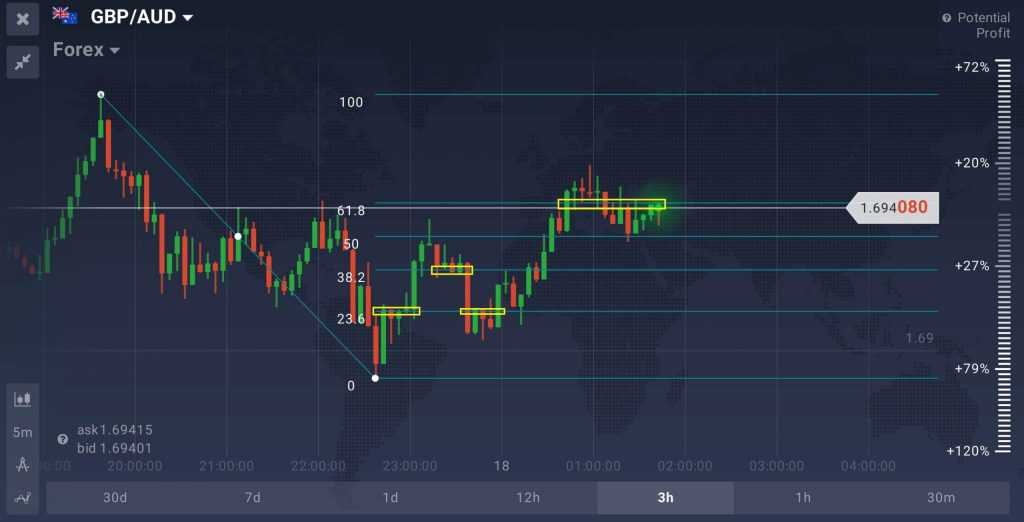
Fibonacci Lines are a powerful technical analysis tool that can be applied to both downward and upward trends, all assets and timeframes. The tool is represented on a price chart as a collection of horizontal lines that correspond to Fibonacci ratios of 23.6%, 38.2%, 50%, 61.8% and 100%. It is used to determine possible support and resistance levels. The tool is named after a 13th-century Italian mathematician Fibonacci and his self-named mathematical sequence. Applied correctly, it can help traders pick the right moment to enter a deal.
How to Use Fibonacci Lines in Trading?
In order to use this tool effectively we first have to understand what support and resistance levels do represent. Support and resistance levels are psychological barriers that the price action is believed to test while moving in a particular direction. When approaching one of the levels, the trend can be expected to either continue its movement or bounce back and reverse. Certain experts believe that trend reversals happen more often around the retracement lines.

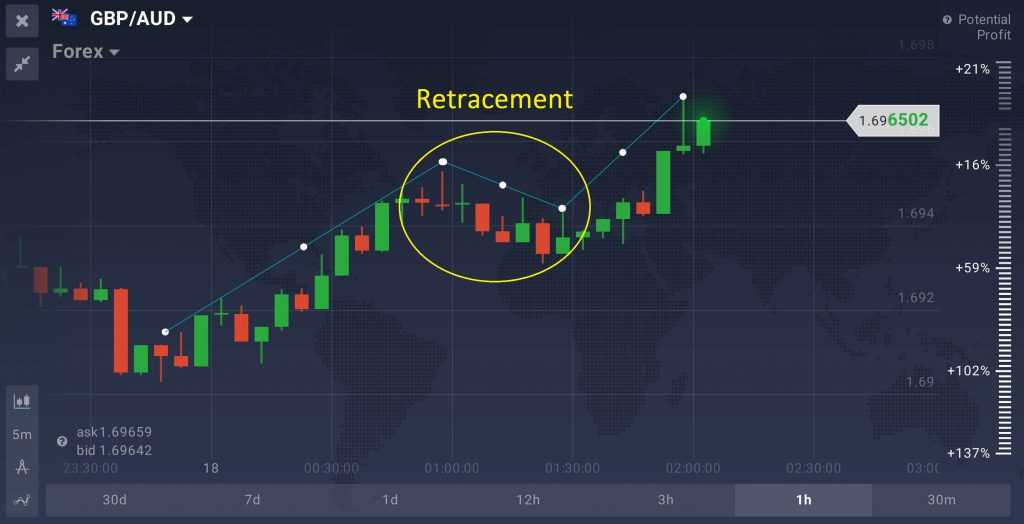
A retracement is a short-term price movement that goes against the general trend, and Fibonacci Lines excel at identifying those movements. The tool can be used to determine both buying and selling opportunities. During the uptrend, Fibonacci Retracement can be used as a buy signal during the pullback. During the downtrend, Fibonacci lines can be used to determine optimal short selling positions.
Some traders believe that the most important retracement level to follow is 61.8, which can also be explained with basic market psychology. The possibility of price swings in this area is higher due to extensive buying or selling pressure (depending on the trend direction). Remember that retracement can be confused with a trend reversal, which in turn can negatively affect your trading performance.

It can also be wise to accompany Fibonacci Lines with one of the momentum indicators (e.g. Stochastic Oscillator or MACD).
Set Up and Apply
Setting up Fibonacci Retracement is easy.
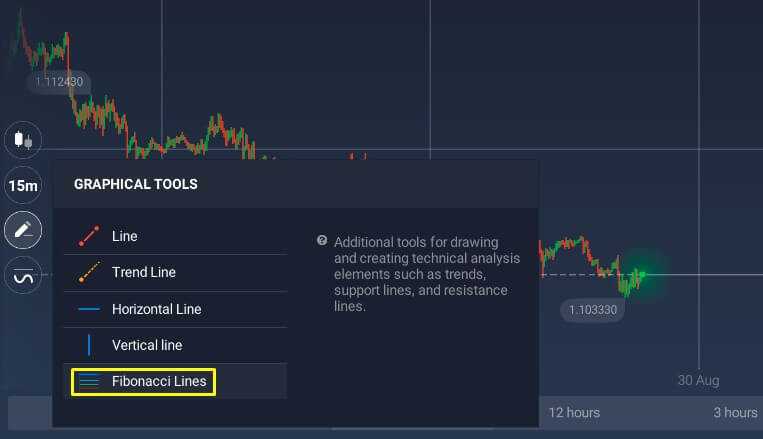
1. Click on the ‘Graphical tools’ button and choose ‘Fibonacci Lines’ from the list of available tools.

2. Find the most recent swing highs and swing lows. For downtrends, click on the swing high and drag the cursor to the most recent swing low. For uptrends, do the opposite: click on the swing low and drag the cursor to the most recent swing high.
3. Fibonacci Retracement levels will then appear on the price chart.
Conclusion
Fibonacci Retracement is an interesting technical analysis tool with limited, yet useful, functionality. Fibonacci Lines help identify optimal entry points during the so-called retracements. Traders, however, have to keep in mind that support and resistance levels provided by this tool are not always foolproof. Instead, they represent “areas of interest”. Fibonacci Retracement does not provide enough information to use it as a leading indicator but can become a useful complementary tool for making medium and long-term decisions.

