
When used on its own, the Stochastic is merely a complimentary tool used to confirm signals from other indicators. However, when two Stochastic indicators with different settings meet each other, they turn into a powerful analysis tool. Dual Stochastic Trade is a strategy based on the use of not one but two Stochastic Oscillators with different settings. Read the full article to learn more about this strategy and how to use it in trading.
The Stochastic (just as most other technical analysis tools) can be found in the bottom-left corner of the trade room under the ‘Indicators’ button. Dual Stochastic relies on the use of two off-chart Stochastic Oscillators. Overbought and oversold levels for both of them are set at 80% and 20%. For the first indicator, the settings are as follows: Period K — 21, Smoothing — 10, Period D — 4. When the first Stochastic indicator is active, you can add the second one but change Period K, Smoothing and Period D values to 5, 2 and 2 respectively. What you will get in the end will look like this:
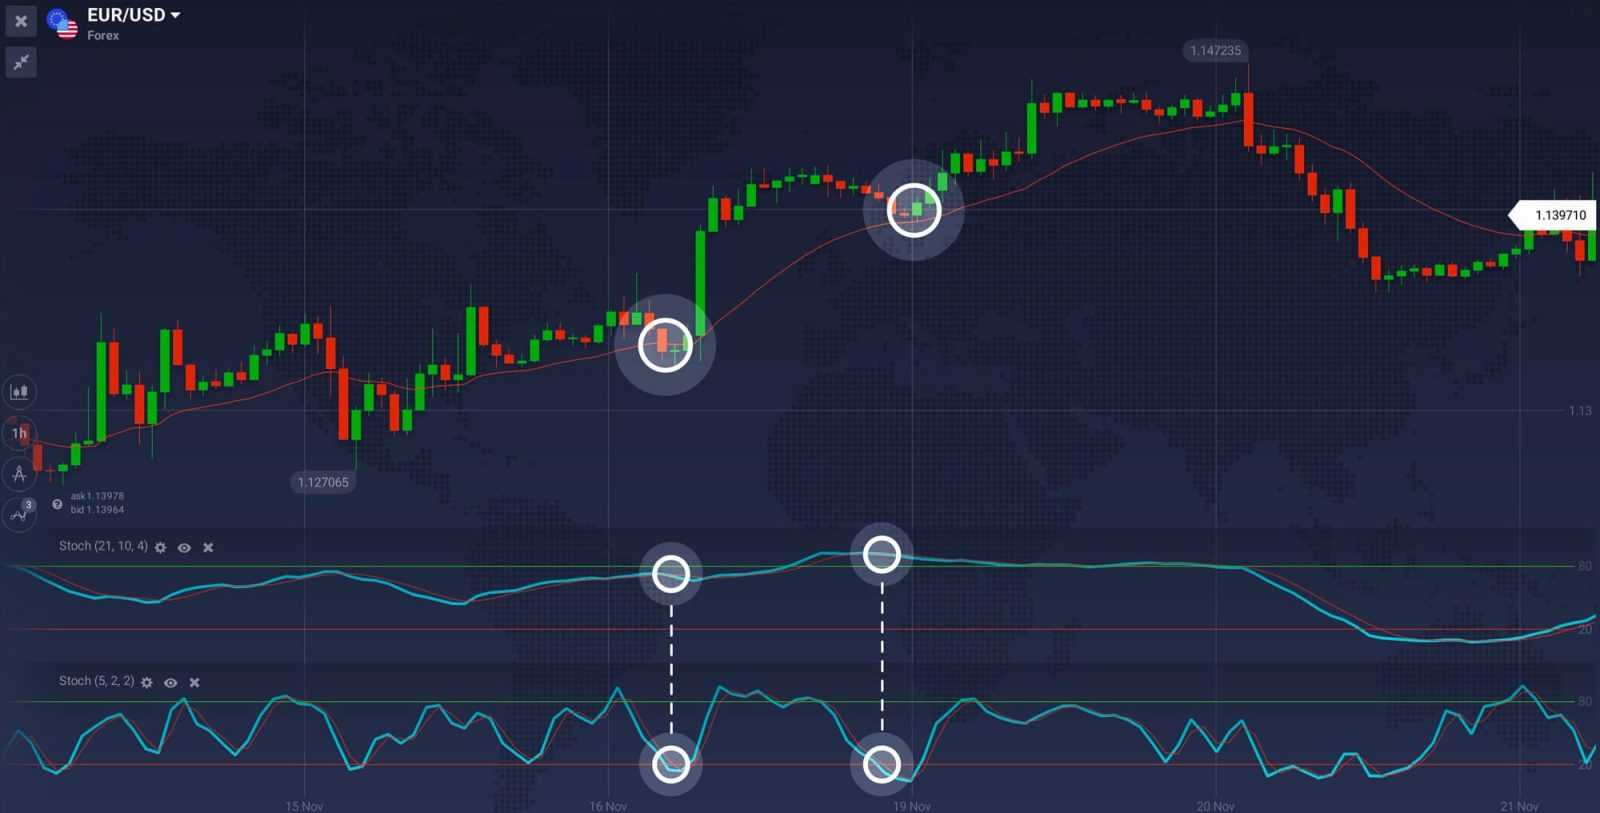
Now, to the trading techniques themselves. When trading in accordance with the Dual Stochastic strategy, traders are looking for a strong trend. They then wait for Stochastic indicators to be at the opposite extremes (when one of them is in the overbought zone, the other in the oversold position). When it happens, the trend can be expected to continue moving in the previously observed direction.
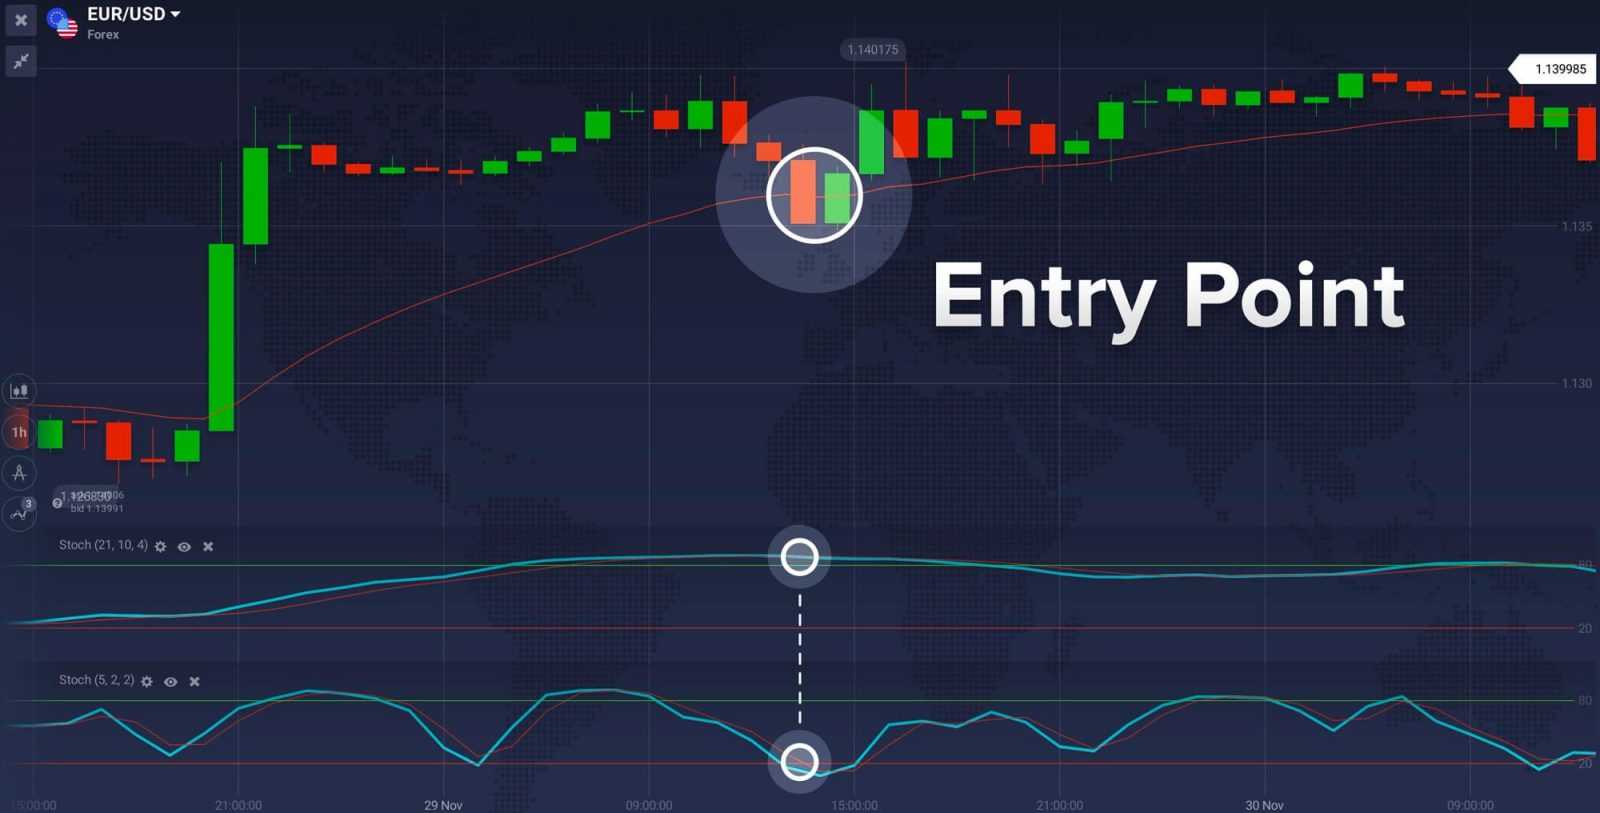
A 20-period EMA can be used as a confirmation. When the candle first crosses on the other side of the moving average (remember that we are talking about a strong trend, all candles are expected to be on one side of the EMA) and then retraces back, a confirmation is received.