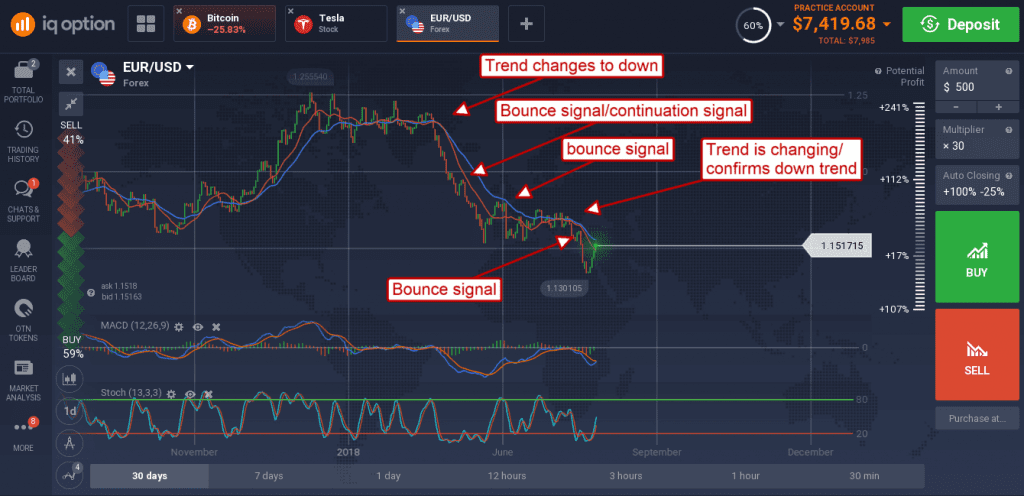
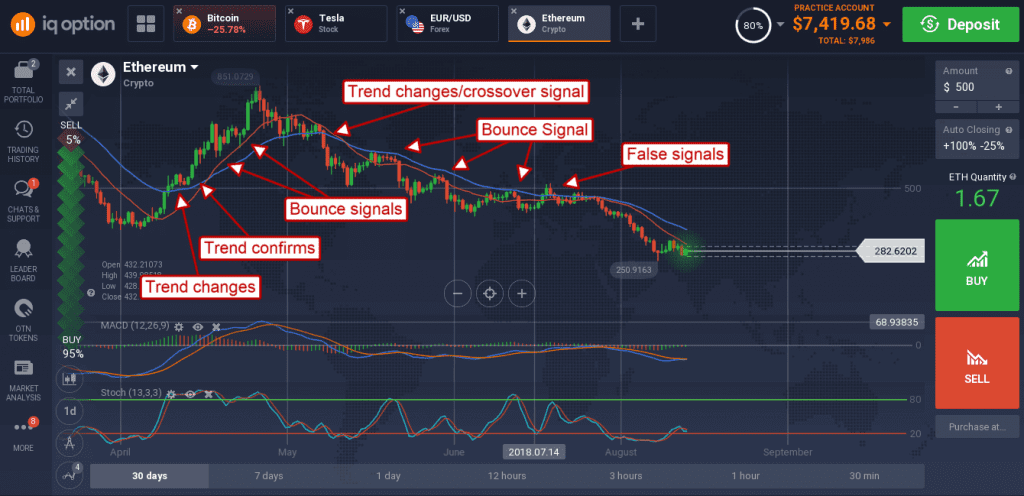
Moving averages are among the most basic forms of technical analysis. They are a computation of average prices over a set number of trading periods and provide deep insight into the market. Regardless the type of moving average (simple, exponential, weighted, triangulated) they indicate trend in both the near and long-term, provide targets for dynamic support/resistance (support and resistance targets that change with conditions) and give clear, easy to follow trading signals any trader can follow.
Where one moving average is good, two are better. In this case I suggest using a longer-term MA and a shorter-term MA. The longer-term MA provides the basic market analysis; what is the trend, which direction are prices moving over time. The shorter-term MA provides the basis for entering positions, it tells you what traders are likely to do today.
For this technique I use a 30-day EMA, the exponential moving average, and a 15-day EMA. The longer-term EMA is the baseline I use to determine trend and how I will choose signals with the 15-day EMA. If the 30-day EMA is pointing up or visibly trending higher over time the trend is up, if the 30-day EMA is pointing lower or visibly trending lower the trend is down. If the trend is up I only trade bullish signals with the shorter-term EMA, if the trend is down I only trade bearish signals with the shorter-term 15-day EMA. If this sounds familiar it should, it is the concept behind the MACD indicator, the moving average convergence/divergence tool but there is a difference in how you use them.

When it comes to trading tactics there are two types of signals a pair of moving averages can make. The first is the crossover signal. A crossover signal is any time the shorter-term EMA moves above or below the longer-term EMA in the direction of the trend. This is the stronger of the two signals and the one more easily traded. The second type of trading signal is any time that the shorter-term EMA bounces from the longer-term EMA. A bounce occurs any time the shorter-term EMA moves up/down to the longer-term EMA, confirms support/resistance, and then moves in the direction of the underlying trend.
Trading these techniques is straightforward, when you see a crossover enter a trade in the direction of the trend. The signals strength is based on the shorter-term moving average which in this case is short. To get a stronger signal use longer-term EMAs like a 50/20-day pairing or a 150/30-day pairing for truly strong signals. The hardest part of this strategy is waiting for a good signal.

Price action may crossover or indicate support/resistance at your moving averages, but the signal is only good when the moving-averages themselves form the crossover. Until then you can expect the MAs to provide support and resistance.

