
Earnings from GM and Boeing beat expectations but outlook is soft and sent US indices down to support levels.
Tariffs Take A Toll On Earnings Outlook
The global trade war has long been feared to halt the global equity rally. While earnings have not yet been impacted the impact of rising input costs are being felt across the business sphere. Earnings from GM and Boeing both beat expectations, top and bottom line, but the outlook for future profits is now in question.
GM, the world’s largest car manufacturer, reported a net YOY decline in earnings as car sales slow and profits are hurt by incentives. Despite this the company beat on the top and bottom lines producing EPS of $1.81, $0.03 better than expected. This news sent shares up by nearly 2% in the wake of the release but the move lasted just long enough for traders to dig into the report. Looking forward GM expects to see full year profit hurt by rising commodity costs and that took impetus out of the market. GM lowered its full year guidance by 10% to $6.00, a move that if echoed across the market could put a serious damper on S&P 500 earnings outlook.

Boeing likewise reported worse than expected earnings and saw shares of its stock fall as well. The company says it grew revenue by 5.2% over the same quarter last year, driven by mid-single digit to low-double digit growth in all segments of operation. The company has also reiterated its full year guidance outlook, maintaining an expectation of $14.30 to $14.50 per share, a nickel below the consensus figure.
On the flipside shares of Coca-Cola were able to move higher and hold the gains on reports it beat earnings estimates. The company saw a 5% increase in organic sales volume that was further aided by price/mix and a 300 BP increase in margins. The question now, for this company at least, is how badly increased cost of aluminum will impact forward earnings potential.

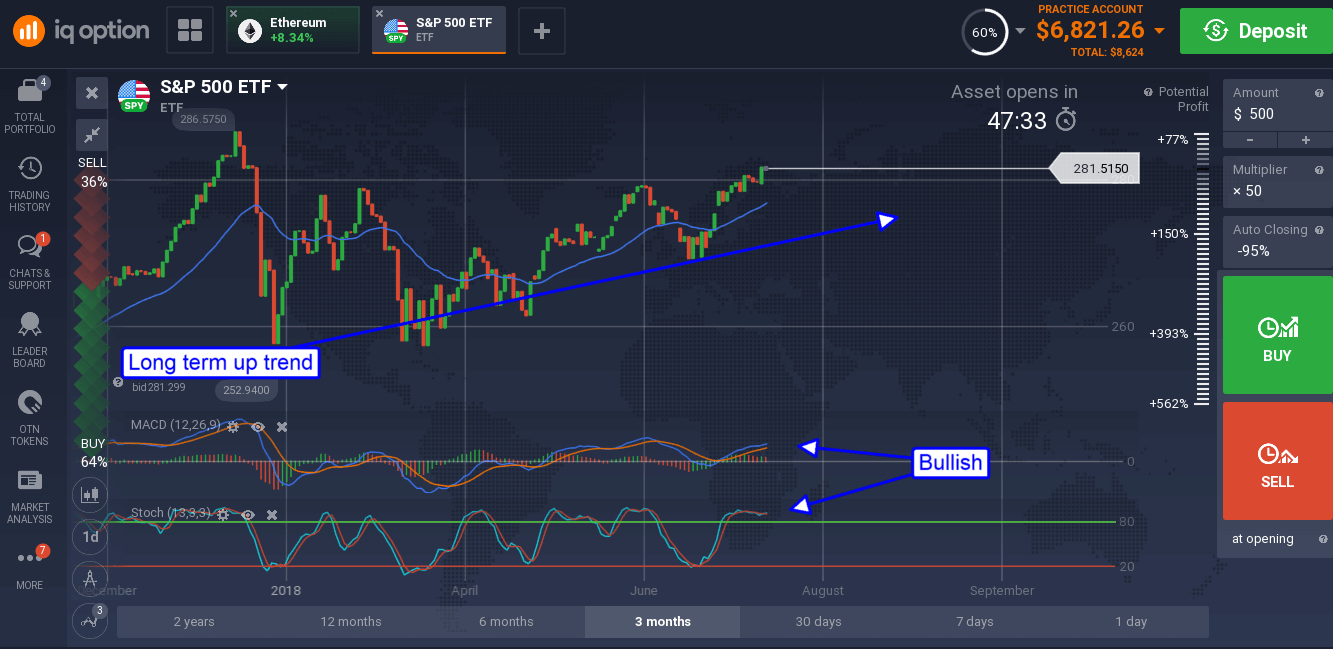
S&P 500 futures pulled back on the earnings news and may be ready to correct. The daily charts show an asset in uptrend and fast approaching a key resistance line at the all-time high. The indicators are bullish but have diverged from the rally (MACD) and are reaching overbought conditions. A move up is likely to find resistance near 2,880 in the near term, a move lower may find support at the short term moving average. The key driver of longer term direction will be outlook, if Wednesday’s news results in a downgrade of full year S&P 500 earnings growth outlook we can expect a deep correction.