Earnings, the profits a company makes from doing business, are what drives the equities market. The reason is simple, a company that makes money is an investment worth your time while one that doesn’t is little more than a speculation and at best an opportunity to go short.
Earnings are what stock is valued by, a change in earnings will result in a change of value. Stock usually trade at a multiple of current or future (expected earnings) called the Price to Earnings Ratio. Companies that trade at a lower forward P/E (price related to future earnings) than a trailing P/E (price related to past earnings) is worth more than a company that doesn’t because the comparison means earnings are growing or expected to grow. When earnings are growing you can be assured that the market will notice and drive the price of the stock up.
The question is how to spot the stocks that have potential to move before those earnings driven moves begin. The answer is simple and comes down to a simple tool called the earnings calendar. The earnings calendar is a listing of all publicly traded companies (stock) expected to report earnings by date. Traders can use this tool to see when companies are expected to report their earnings use that knowledge as a starting point to research new equity (stock) based trades.
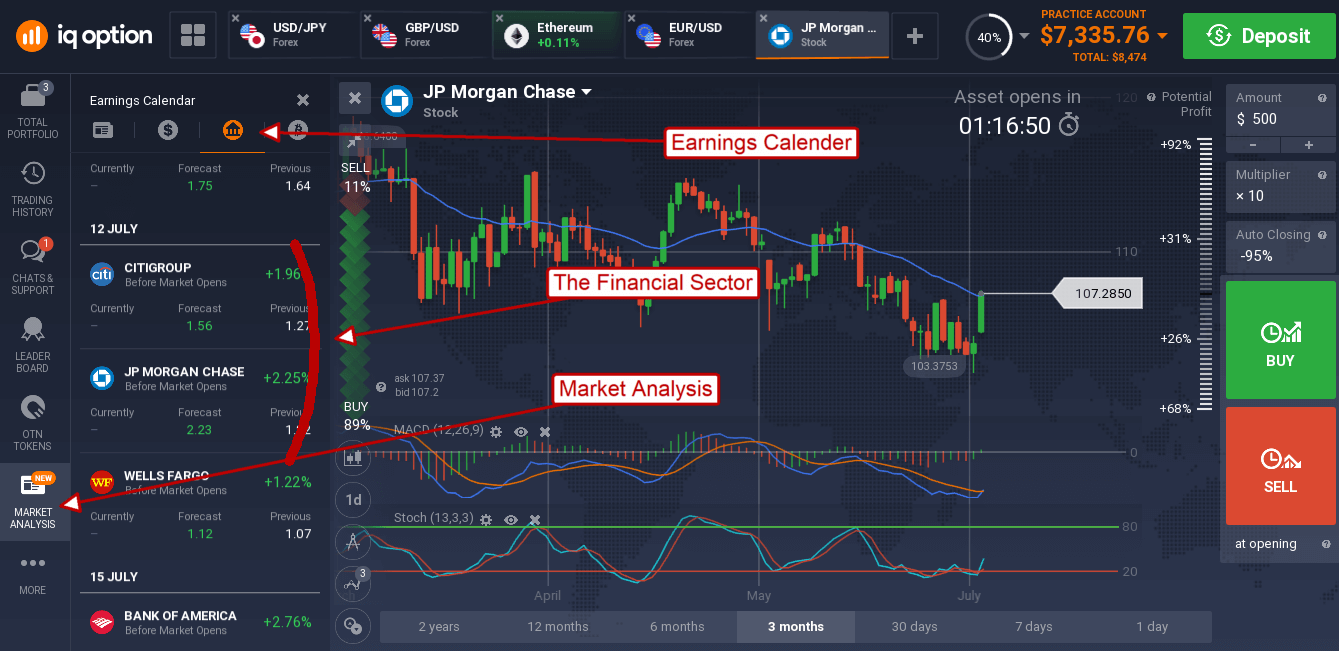
For example, this week is the first week of the 2nd Quarter 2018 Earnings Season. A look at IQ Option’s Earnings Calendar, accessible through the trading platform, shows some major US banks are scheduled to report this week. These banks include JP Morgan, Citigroup and Wells Fargo; the banking sector is expected to show robust earnings growth this quarter, more than 25%, which makes it a great sector for bullish trades. Conversely, if a sector’s earnings were expected to decline it would be a good sector for bearish trades.
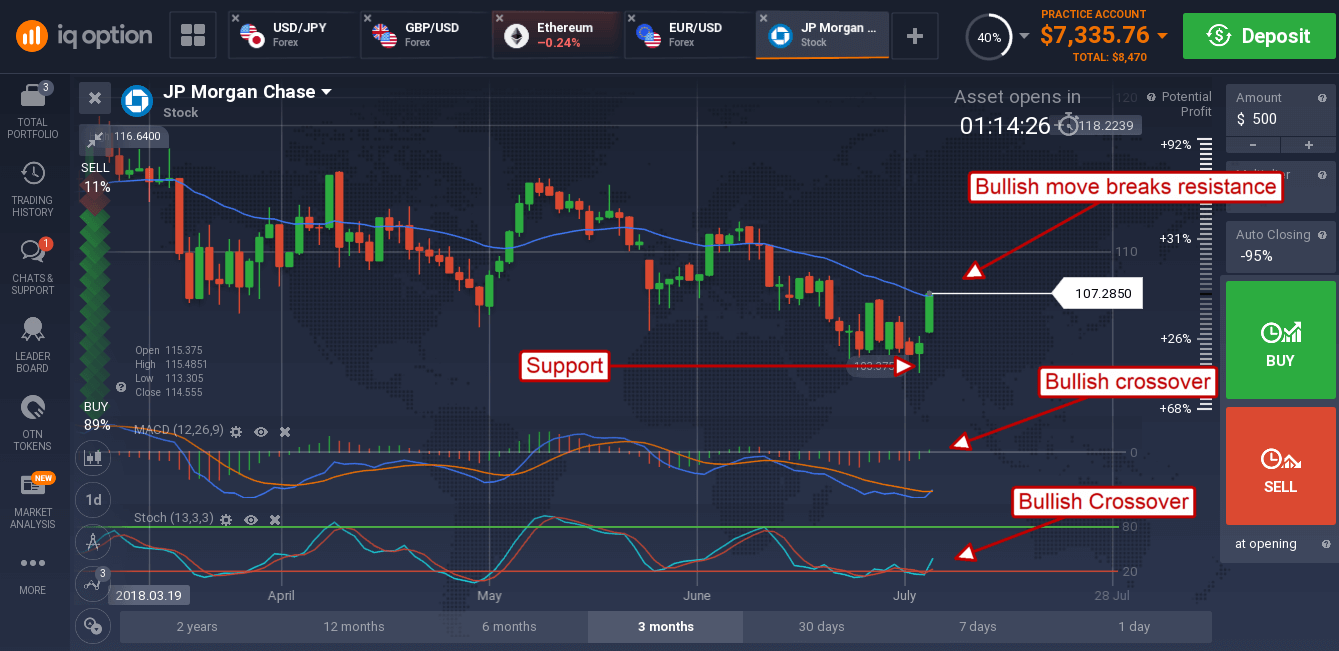
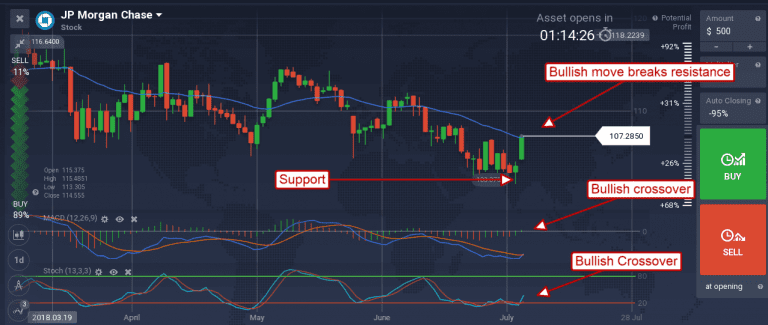
Using the IQ Option platform is super easy, pull up the calendar, spot potential assets with upcoming earnings and click them to pull up a chart. In this case I choose JPMorgan because I prefer it to Citigroup and Wells Fargo, both of which are also available on the IQ Option platform in CFD format. A look at this chart shows JPM is bouncing strongly off a support level and has broken the 30-day moving average. The indicators confirm the break of resistance with bullish crossovers and suggest upward movement has begun.
