ADP and GDP figures were released on Wednesday and reveal two things. The first is that the US economy is still expanding, the second is that it is not expanding quite as fast as expected earlier in the year and that has set the dollar up for reversal. The dollar has been gaining strength in recent weeks, driven by increasing expectation of FOMC action and geo-politics, and those situations have led to a weak and extended market.
Wednesday’s ADP figure came in a little light at 178,000. This figure is not bad, but it does not suggest acceleration in the economy and is further shadowed by a downward revision to the previous month. The previous month was revised down by 41,000 to 163,000. The good news is that job gains are broad across industry, sector and business size and led by construction. Construction gains are important to not as the housing market has been lagging due to low inventory, more workers mean more houses will come on to the market later this year.
The second revision to first quarter GDP came in a little lighter than expected as well. The 2.2% reported is down a tenth from the previous estimate due to revisions to personal consumption and consumer level inflation. The PCE price index was revised down by -0.1% putting the quarterly change at -0.2% and deflating expectations for an FOMC rate hike in June. The CME’s Fedwatch Tool is now showing only an 80% for hike at the June meeting and less than 30% chance of three more hikes this year.
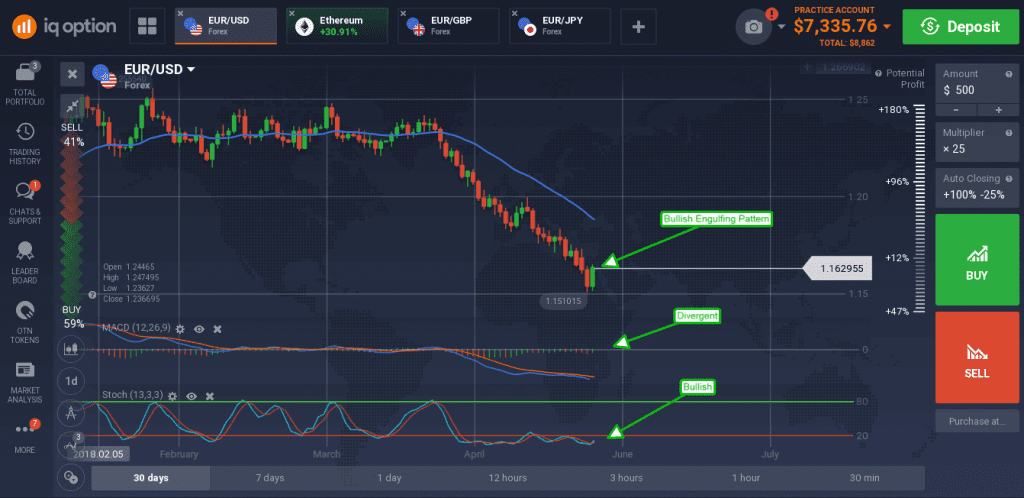
Data due on Thursday and Friday includes the Personal Consumption and Spending figures for April, a more current read, and the NFP with average hourly earnings; any weakness is sure to have the dollar losing ground. The EUR/USD has already indicating support and possible reversal with a bullish engulfing pattern formed in early Wednesday trading. The pattern is supported by bullish crossover in stochastic and bullish divergence in MACD that could lead to a rebound in prices if not a full reversal. A move up will face resistance at 1.6670, a move above there will be bullish.

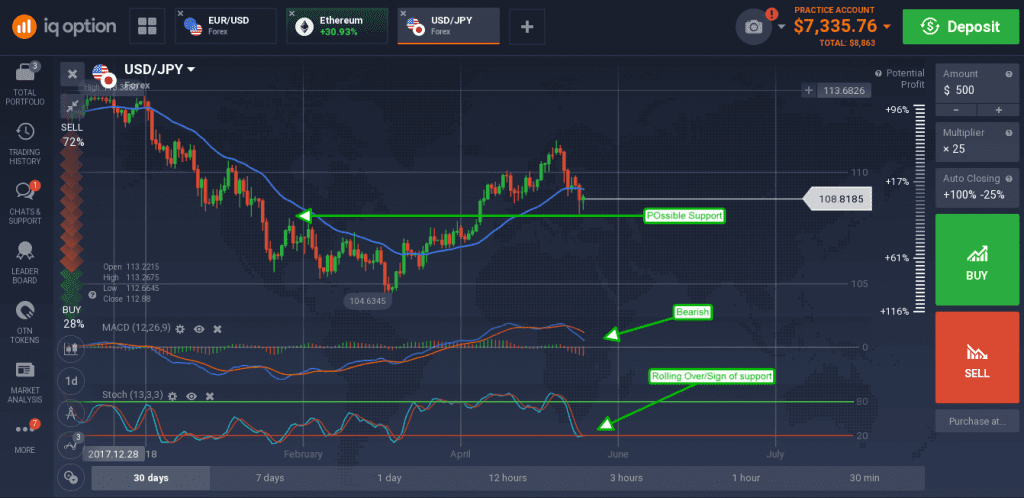
The USD/JPY experienced a correction driven by recent geopolitical upheavals in US/China trade relations, NAFTA, North Korea and EU politics. The pair fell below the short term moving average but is showing signs of support at the 108.50 level that could impede further decline.

The indicators are both rolling over while the pair is at the support level which suggest support could be strong. The risk if the data, if the US data comes in soft or in any way suggests the FOMC will not need to hike rates much more the dollar is sure to fall.

