Risk is one of the most fundamental factors in trading. All investors, no matter what asset they trade, try to accurately estimate risk. The reason for that is simple: the latter can — and most certainly will — influence the outcome of the deals.
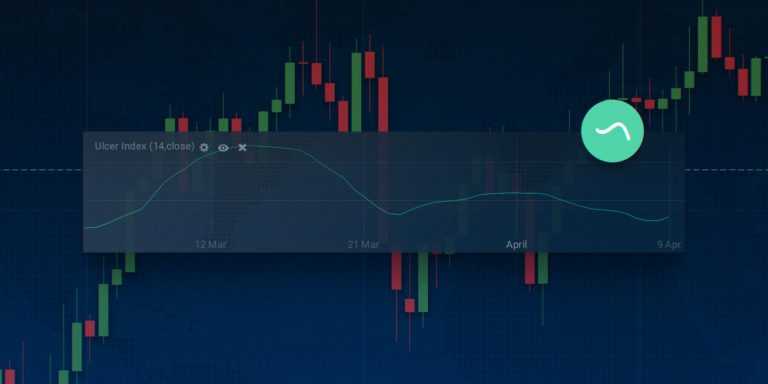
Ulcer Index is a technical analysis indicator that helps measure risk associated with a particular asset on a local level (remember that no technical analysis indicator can measure fundamental risk). To be even more precise, it measures downside risk: risk of the asset price going down.

In trading, the higher the risk, the higher the potential return. In order to understand this statement you may use as an example of the comparison of the behavior of Bitcoin and EUR/USD over the course of 2017. On 1 January 2017, an investor could buy 1 BTC for $963. The same Bitcoin could then be sold for $19,758 twelve months later. The difference in prices translates into a 1,951% return. Now, imagine buying a EUR/USD currency pair and holding it until the end of 2017. On January 1st one Euro was worth $1.0532. At the end of December 2017, it was worth $1.2029, ‘only’ 14% percent higher.*
However, the associated risk of Bitcoin is also much higher than that of EUR/USD. In one and a half months that followed BTC has lost over 60% of its market value. During a 1.5-month-long decline EUR/USD has only lost 9.5% of its value. As you can see, at one point in time Bitcoin has offered outstanding returns but potential buyers were just as likely to lose the lion’s share of their investment. And this is exactly why you would want to know the risk associated with an asset you are about to trade.
How to use?
Being a single-line indicator, Ulcer Index is easy to set up and use. By looking at the indicator itself you would know that it goes up when the risk of a price decrease is growing and down when the risk of a negative price movement deteriorates. The greater its value, the longer it takes for an asset to reach its most recent high. There are several ways to use this indicator.

First, you can verify entry and exit points from other indicators. Ulcer Index is not as good as trend-following and oscillator-type indicators in identifying entry and exit points all by itself. However, being a complementary tool, it can help you either approve or reject signals, provided by other indicators.
Secondly, this indicator can help you decide for how long to keep the position open. The longer the asset price is growing, the higher the downside risk. Here is what you can do: pinpoint a particular level of risk that you find acceptable and close the deal once it is reached. Note that it may take some time to find the optimal threshold.
Please note that no technical analysis indicator is capable of providing accurate results 100% of the time and should not be used on its one (but rather as an additional tool to your judgment).
How to set up?
Setting up the indicator is easy. In order to do so, follow these three steps:
1. Proceed to the trade room and click the ‘Indicators’ button in the bottom left corner of the screen.
2. Go to the ‘Other’ tab and find Ulcer Index in the list of available indicators.
3. Click the ‘Apply’ button without changing the setting. The indicator is ready to use!
Conclusion
Ulcer Index is an interesting indicator that can help you estimate risk from a technical point of view. Consider using it as a part of your trading system and combining it with indicators that excel at identifying entry/exit points. Now, when you know how it functions, proceed to the trading platform to give Ulcer Index a try!
*Past performance is not an indicator of future performance.


