

What Is Fibonacci Retracement
Fibonacci retracement is a tool that plots potential pullback levels based on the Fibonacci sequence. This tool uses a swing high and a swing low, dividing the price distance between them into specific ratios. The most used ratios are 23.6, 38.2, 50, 61.8, and 78.6.
These levels act as possible areas where price may slow down, bounce, or reverse. Traders watch them because markets often react around these ratios due to repeated patterns in price behavior. The idea is simple. After a strong move, the price often retraces a portion of that move before continuing. Fibonacci retracement helps measure that portion.
On the IQ Option chart, the tool is added with one click. Traders drag it from a key low to a key high, or from a key high to a key low, and the platform automatically plots the levels.
How Fibonacci Retracement Works
Fibonacci retracement works by measuring how much of a previous move the market pulls back before continuing in the same direction. In a strong uptrend, the price creates a swing high and then retraces lower. In a downtrend, the price forms a swing low and then retraces higher.
The tool marks these retracement zones using the Fibonacci ratios. Each ratio represents a percentage of the previous move. For example, a 38.2 level means price has retraced 38.2 percent of the prior swing. These levels help traders see where buyers or sellers may step back in.
The idea behind this is that markets rarely move in straight lines. Trends are built from impulse waves followed by corrective waves. Fibonacci retracement gives structure to these corrective waves and helps traders understand where the next impulse wave may start.
When to Use Fibonacci Retracement
Fibonacci retracement works best in trending markets. The tool helps locate potential pullback zones where price may resume the trend. Traders use it after a clear impulse move, once the market starts to retrace.
The tool is applied in an uptrend from a major swing low to a major swing high, showcasing pullback levels from where buyers may return. In a downtrend, the tool is drawn from a swing high to a swing low, highlighting areas from where sellers may step in again.
The tool is not ideal during sideways or choppy markets. When price moves without direction, retracement levels lose their meaning. In order to get a reliable signal from this tool, traders need to await a clean trend with strong momentum and clear swing points before applying Fibonacci retracement.
How to Draw Fibonacci Retracement Correctly
Drawing a Fibonacci retracement is easy, but accuracy does count. For traders, clear swing points are required and a confirmed trend before placing the tool on the chart.
In an uptrend, start by finding the most recent major swing low and swing high. Select the Fibonacci tool on the IQ Option platform and drag it from the swing low up to the swing high. The retracement levels will appear automatically. These levels mark areas where the pullback may find support.
In a downtrend, the process is reversed. Identify the major swing high and swing low. Drag the tool from the swing high down to the swing low. The plotted levels now act as potential resistance zones during the pullback.
Many traders make the mistake of using small or random swing points. The tool works best when drawn on clear, meaningful swings. It also helps to align the Fibonacci levels with previous structure zones, as this adds confirmation and improves accuracy.
Understanding Fibonacci Retracement Levels
Fibonacci levels measure the depth of a pullback during a trend. Each level reflects a different type of correction and assists traders in judging the strength of a trend.
- 23.6 percent. This is a very shallow pullback. It shows strong momentum because buyers or sellers are not allowing a deep correction. Trends that hold above this level often continue quickly.
- 38.2 percent. This is a normal and healthy correction. Many stable trends retrace to this level before moving again. Traders often look for early entries here when momentum remains strong.
- 50 percent. This level marks the midpoint of the previous move. Price often pauses or reacts here due to simple market psychology. Many traders use it as a neutral zone to judge if the pullback will deepen or reverse.
- 61.8 percent. This is the most-watched level in Fibonacci analysis. It is a deep pullback, but still supports the idea of trend continuation. Strong reversals often start from this area when the trend remains intact.
- 78.6 percent. This is the final retracement level before the trend is at risk. If price respects this zone, the trend may continue, but if it breaks with force, momentum is often fading. Traders see this level as a warning that a reversal may form.
Fibonacci Retracement Trading Strategies
Fibonacci retracement works well in trending markets. Traders use it to find pullback zones and plan entries with more structure. Here are the most common ways to use it in real trading conditions.
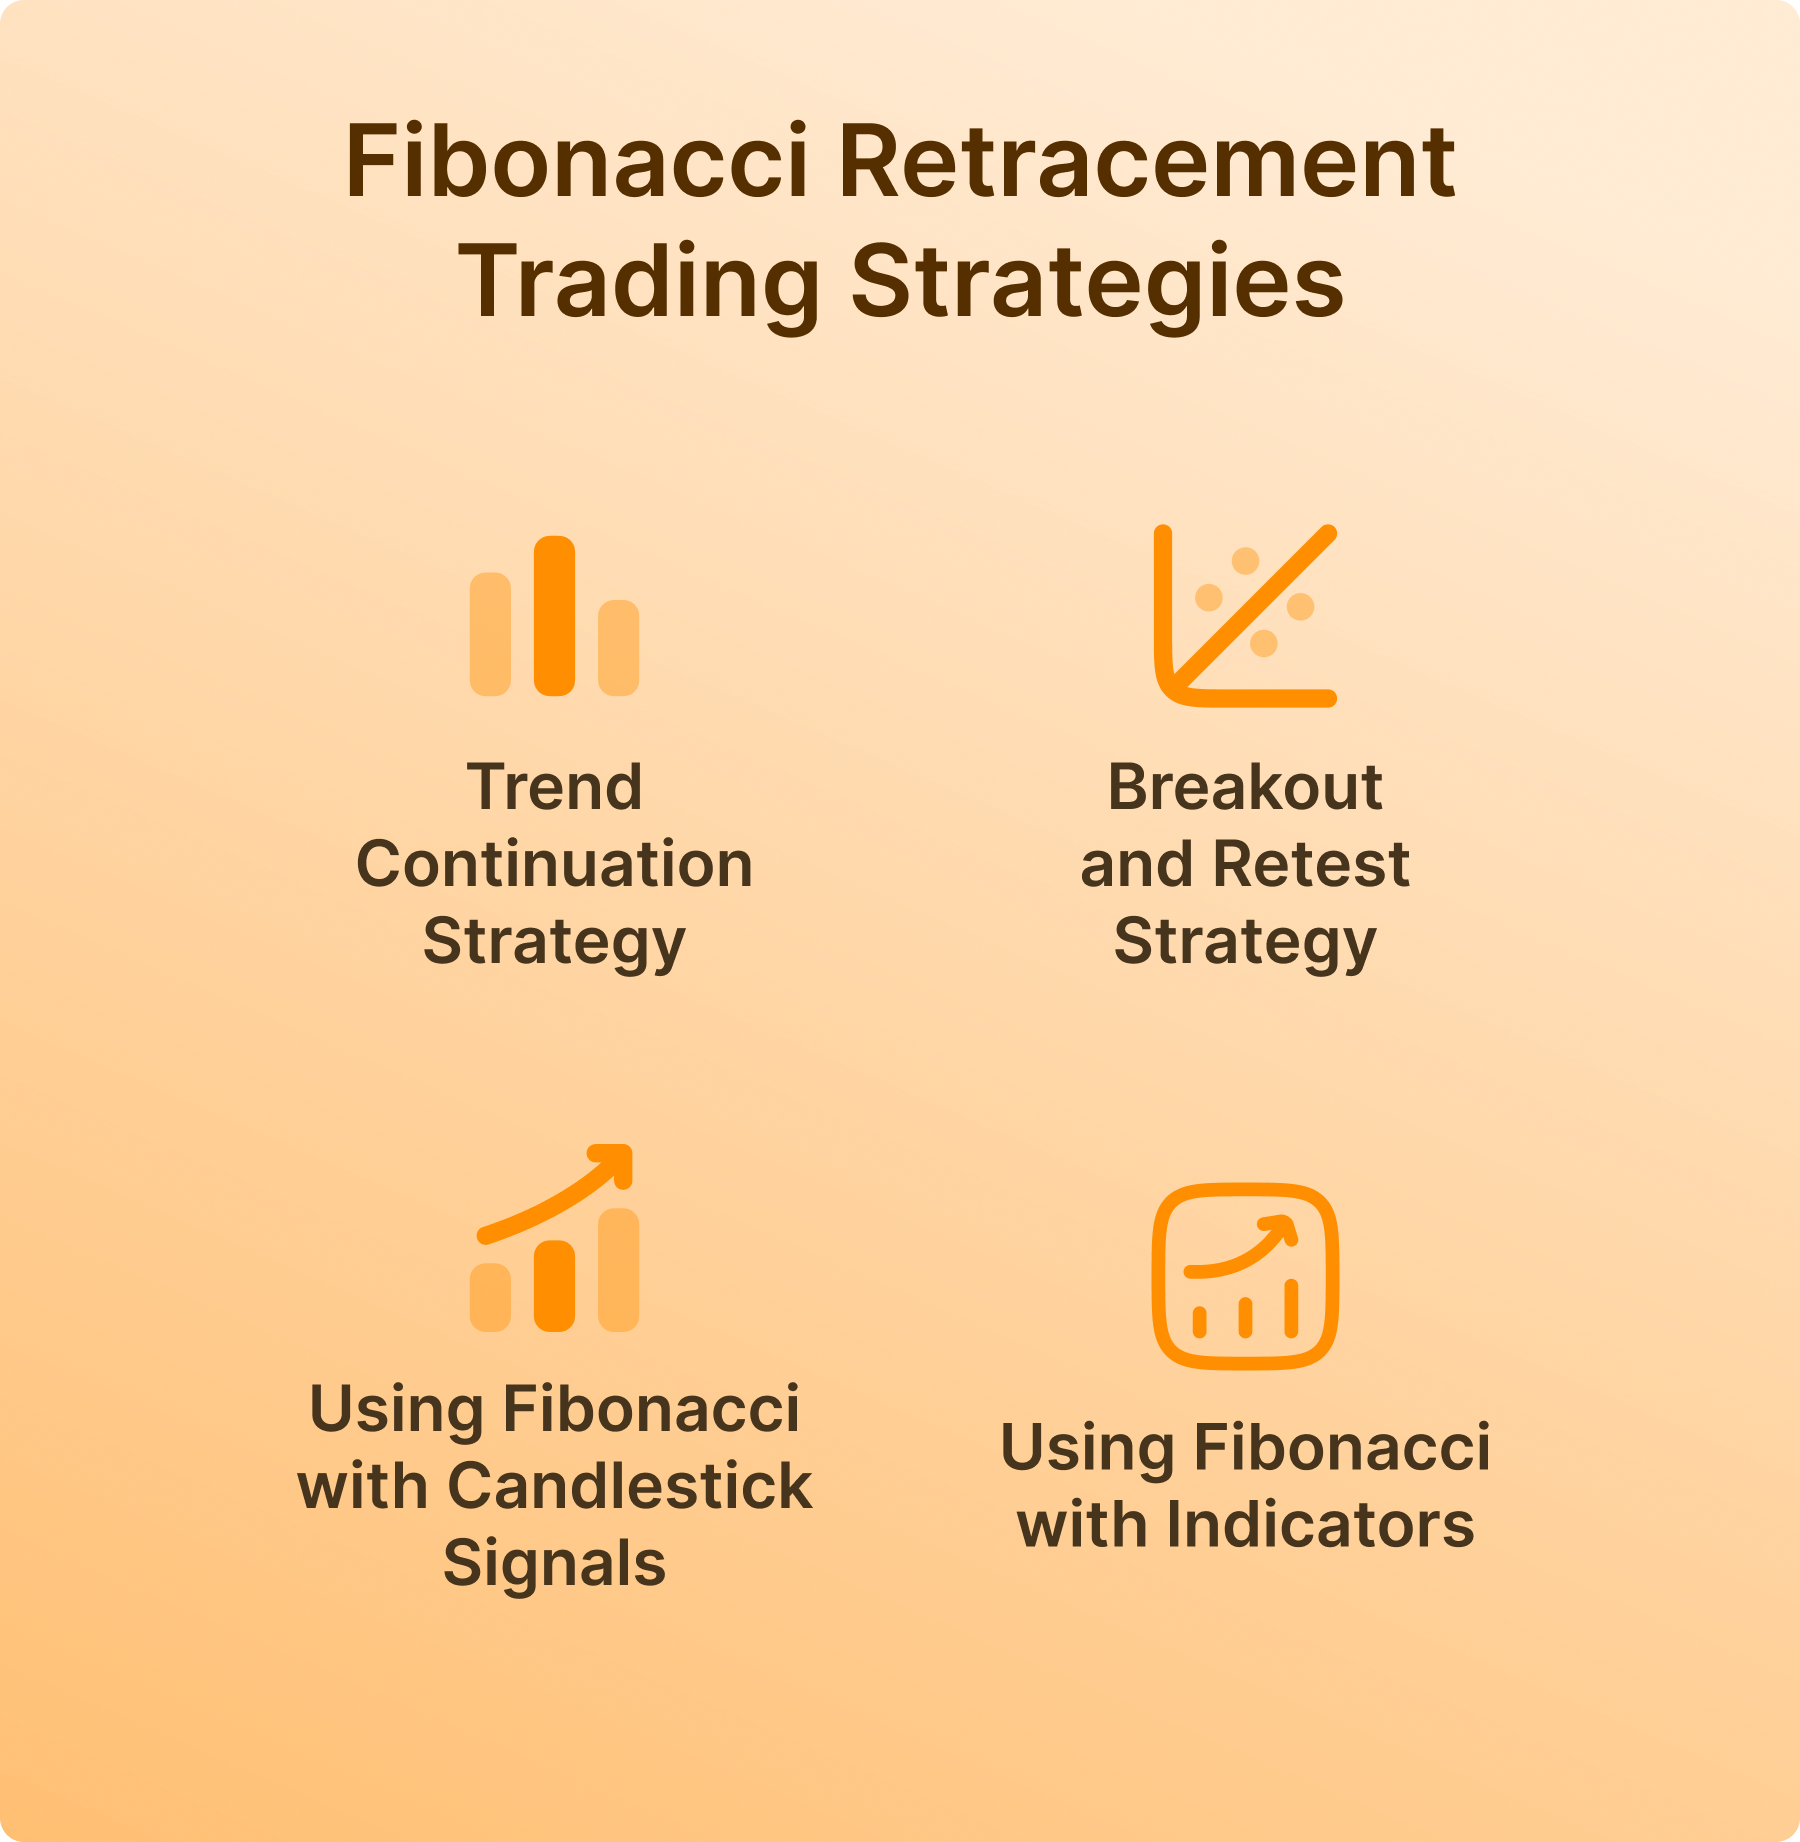
Trend Continuation Strategy
This is the most popular application of Fibonacci retracement. Traders wait for the market to pull back during a clear trend and then look for a reversal from one of the retracement levels. The idea is simple. A strong trend pauses, pulls back to a level, shows a rejection, and then continues in the same direction. The entry follows the momentum once the price confirms the bounce.
Breakout and Retest Strategy
Breakouts often retrace before continuing. After a price breaks a major high or low, it usually pulls back to test the broken area. Many of these retests align with Fibonacci levels. Traders wait for the breakout, let the market return into a Fibonacci zone, and then enter when the chart confirms continuation. This creates a cleaner and safer entry than chasing the breakout itself.
Using Fibonacci with Candlestick Signals
Candlestick patterns can confirm whether buyers or sellers are defending a Fibonacci level. Rejection wicks, engulfing candles, or strong reversal patterns show that the market respects the zone. Traders wait for the price to reach a key level and then watch how the candle closes. A strong rejection often signals that the trend is ready to resume.
Using Fibonacci with Indicators
Indicators help filter weak signals. Moving averages can confirm trend direction. RSI can show if momentum supports a return to the trend. MACD can highlight a shift in strength. When a Fibonacci level aligns with indicator confirmation, the setup becomes more selective and more reliable. Traders use this confluence to reduce false entries and improve timing.
Best Practices for Fibonacci Trading
Fibonacci retracement is effective only when applied with discipline. The tool highlights potential zones, but the trader still needs structure and confirmation. Following a few best practices helps improve accuracy and reduce false entries.
- Trade With the Trend – Fibonacci retracement works best in trending markets. The tool measures pullbacks inside a trend, not reversals. If the market has no clear direction, the levels lose value and reactions become random. A clean trend gives the levels meaning.
- Use Clear Swing Points – The tool is only as accurate as the swings you select. Using small or unclear swings creates unreliable levels. Choose obvious highs and lows that stand out on the chart. Clean structure improves every signal that follows.
- Wait for Confirmation – Fibonacci levels are not entry signals on their own. Traders wait for price action to confirm the level. Rejections, strong candles, or momentum shifts help validate the pullback area. Confirmation adds safety to every trade.
- Combine Levels With Other Tools – Fibonacci retracement is stronger when aligned with indicators or price structure. Moving averages, trendlines, and support or resistance levels help filter weak setups. When multiple signals align, the probability improves.
- Avoid High Volatility News – During news events, price may ignore all levels. Pullbacks become unpredictable and spread widens. Fibonacci retracement works best in normal market conditions where structure remains intact.
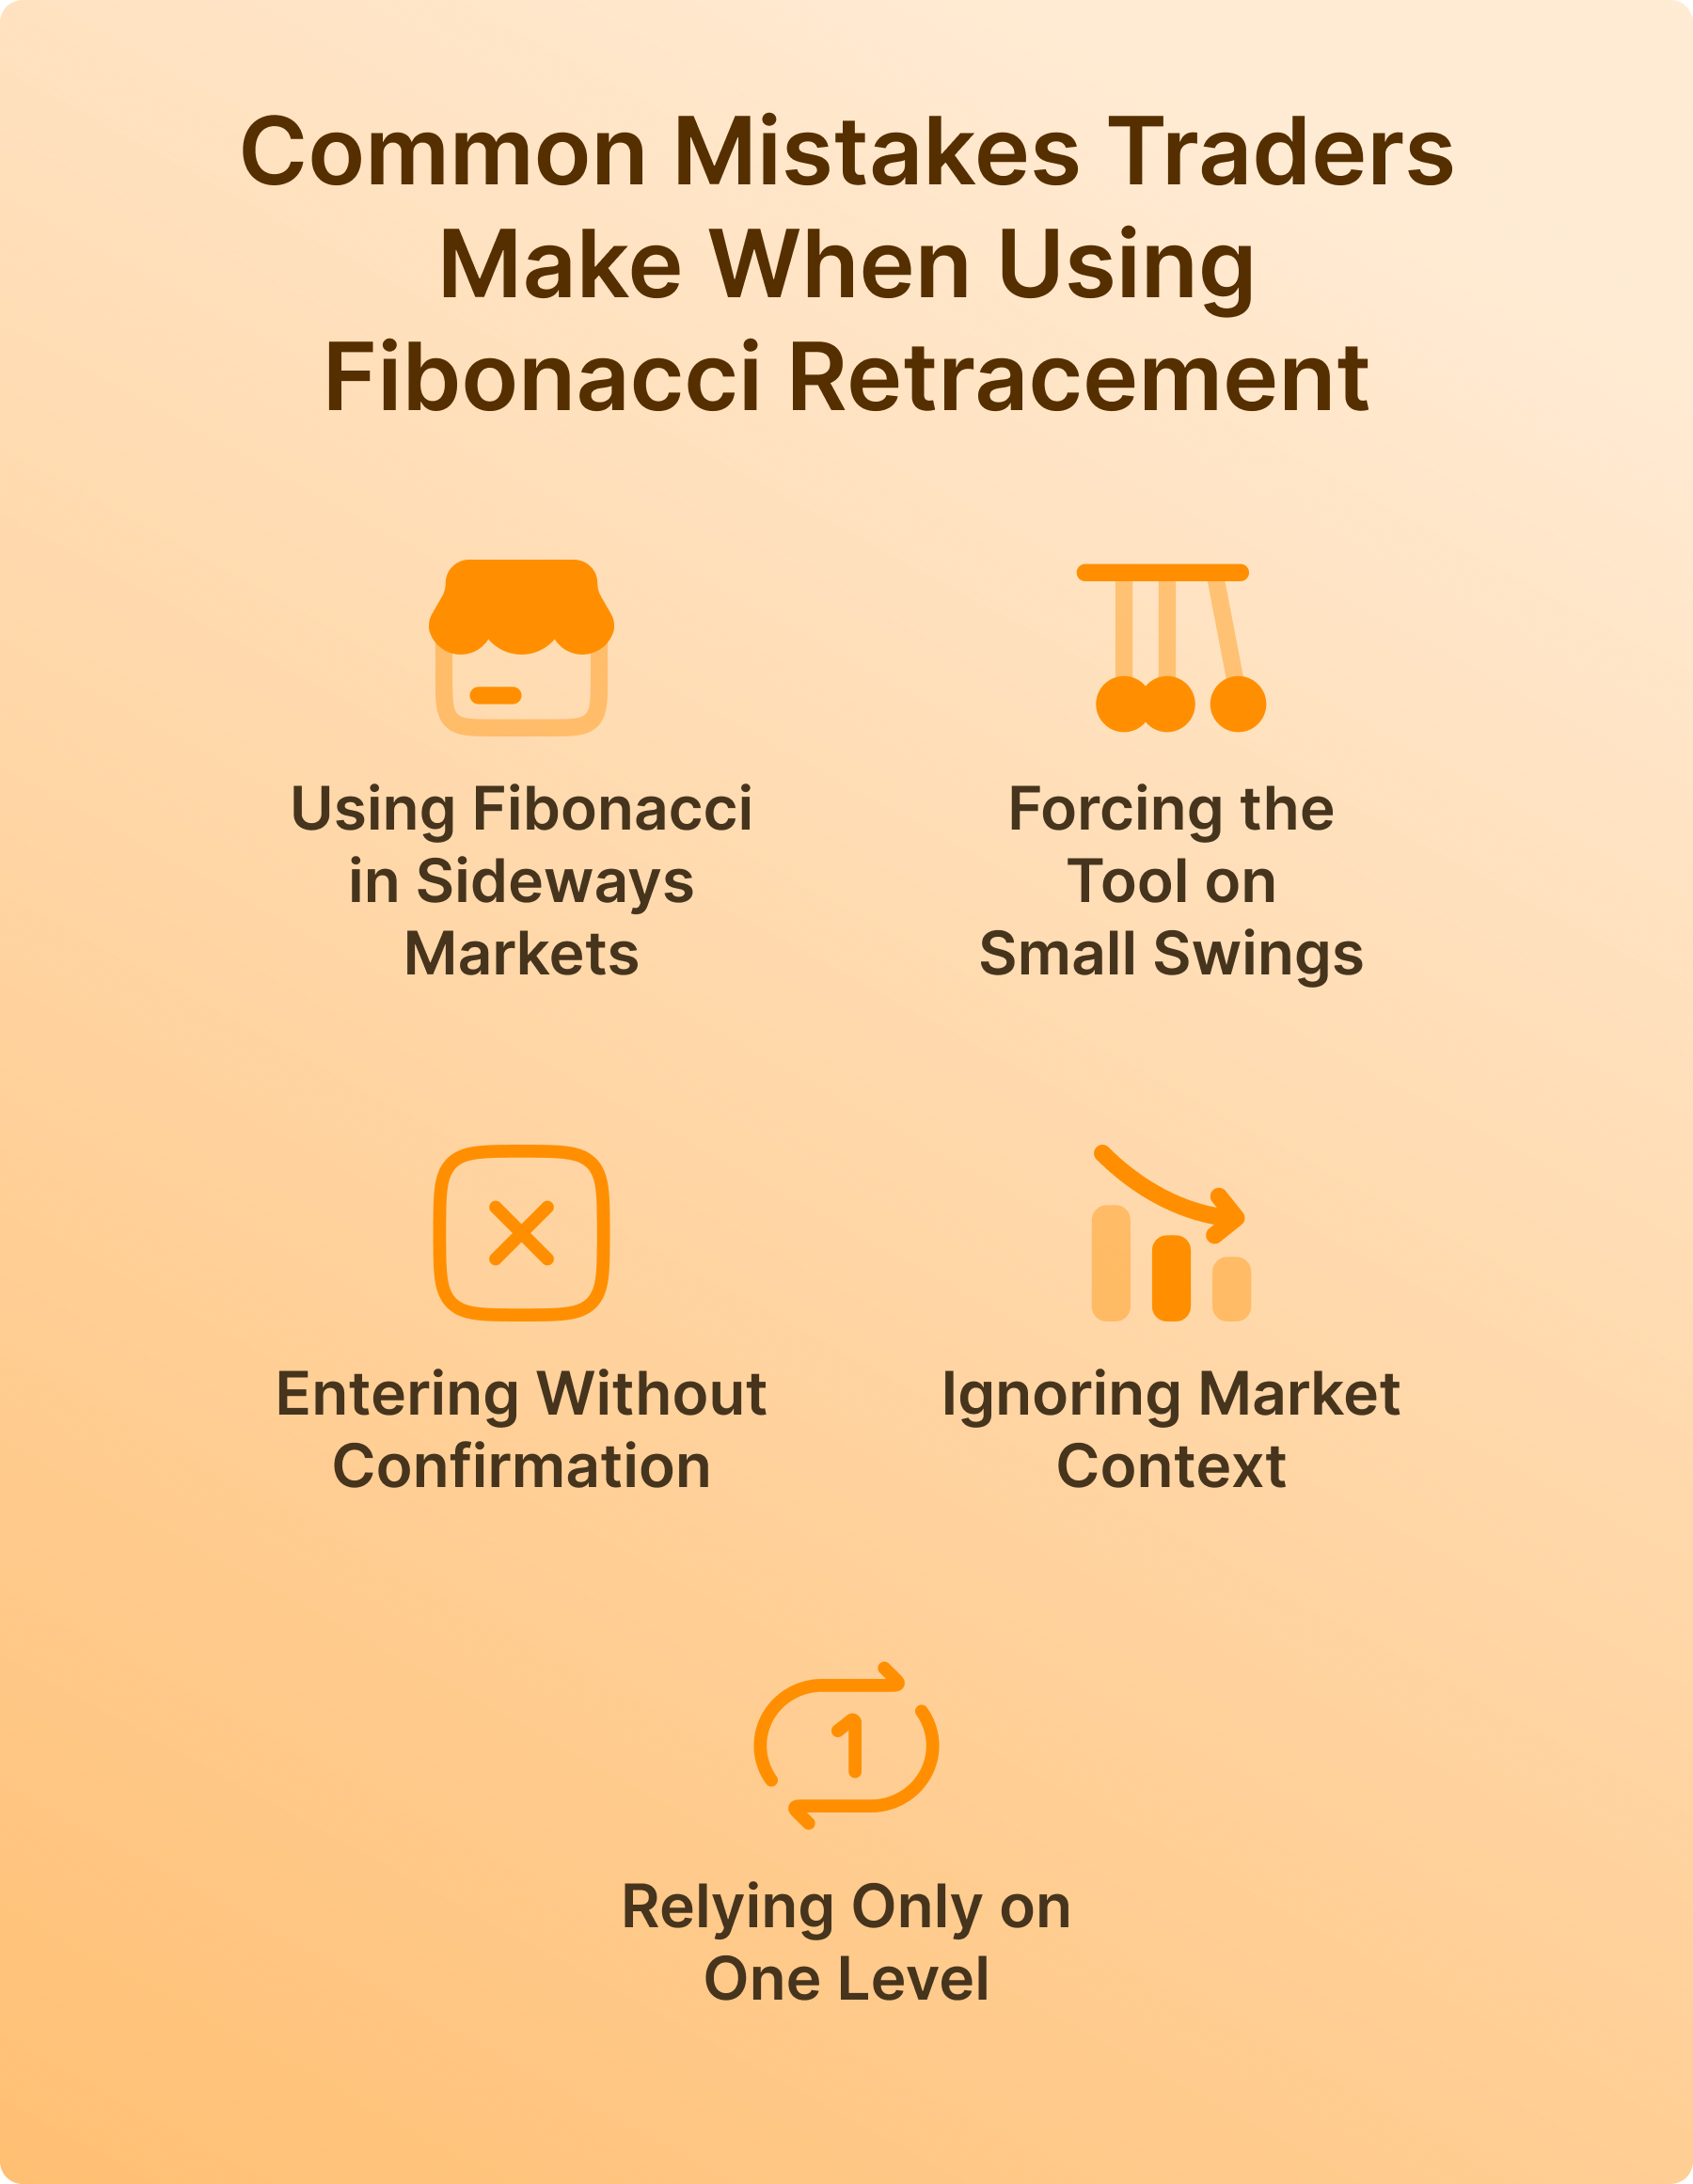
Common Mistakes Traders Make When Using Fibonacci Retracement
Many traders know how to draw Fibonacci retracement, but errors in application often lead to weak signals and avoidable losses. Understanding these mistakes helps improve accuracy and consistency.
- Using Fibonacci in Sideways Markets – The tool works best in clear trends. When price moves sideways, pullbacks do not follow structured patterns and levels lose their meaning. Traders often get false reactions in choppy markets.
- Forcing the Tool on Small Swings – Using very small highs and lows creates unreliable levels. The market needs enough distance between swings for Fibonacci to produce meaningful zones. Forced drawings lead to confusion and inconsistent results.
- Entering Without Confirmation – A Fibonacci level is not enough on its own. Traders who enter as soon as price touches a level take unnecessary risk. Waiting for a strong candle, rejection, or shift in momentum improves timing and reduces false entries.
- Ignoring Market Context – Fibonacci retracement should match trend direction, momentum, and structure. If the overall market is weak or unstable, a simple retracement level is not enough. Traders must view the level within the broader chart environment.
- Relying Only on One Level – Many traders choose a single favorite level and trade only that one. Markets react to different levels at different times. A flexible approach that watches several key zones creates more balanced decision making.
Limitations of Fibonacci Retracement
Fibonacci retracement is a helpful tool, but it has clear limits. Traders should understand what it can and cannot do when analyzing a market.
Not a Standalone System
Fibonacci levels show possible pullback areas, but they do not predict direction on their own. The tool needs support from trend structure, price action, or indicators. Without confirmation, the levels become guesswork.
Does Not Predict Trend Strength
Fibonacci retracement measures the depth of a correction. It cannot show if the trend is strong enough to continue. The market may break all levels if momentum shifts. Traders still need to read trend behavior.
Depends on Correct Swing Selection
The tool is only as good as the swings used to draw it. Wrong placement creates misleading levels. Clear highs and lows are essential for accurate results.
Less Effective in Volatile Markets
During news events or sudden spikes, price moves unpredictably. Retracement levels may break without any reaction. The tool works best when the market follows normal, structured movement.
Subjective at Times
Different traders may choose different swing points. This creates slight variations in levels. Even though the idea remains the same, execution varies. Traders must stay consistent with their own method.
In Summary About Fibonacci Retracement
Fibonacci retracement is a simple and effective tool for measuring pullbacks during a trend. It helps traders find areas where the rice may pause or reverse before continuing in the same direction. When applied with clear swing points, confirmation signals, and strong trend structure, Fibonacci levels add precision to entry and exit planning.
The tool works on any asset and any timeframe on the IQ Option. Traders can apply it with one click and use it to guide positions with more structure and confidence. As with any method, Fibonacci retracement is most effective when combined with price action, indicators, and disciplined risk management.