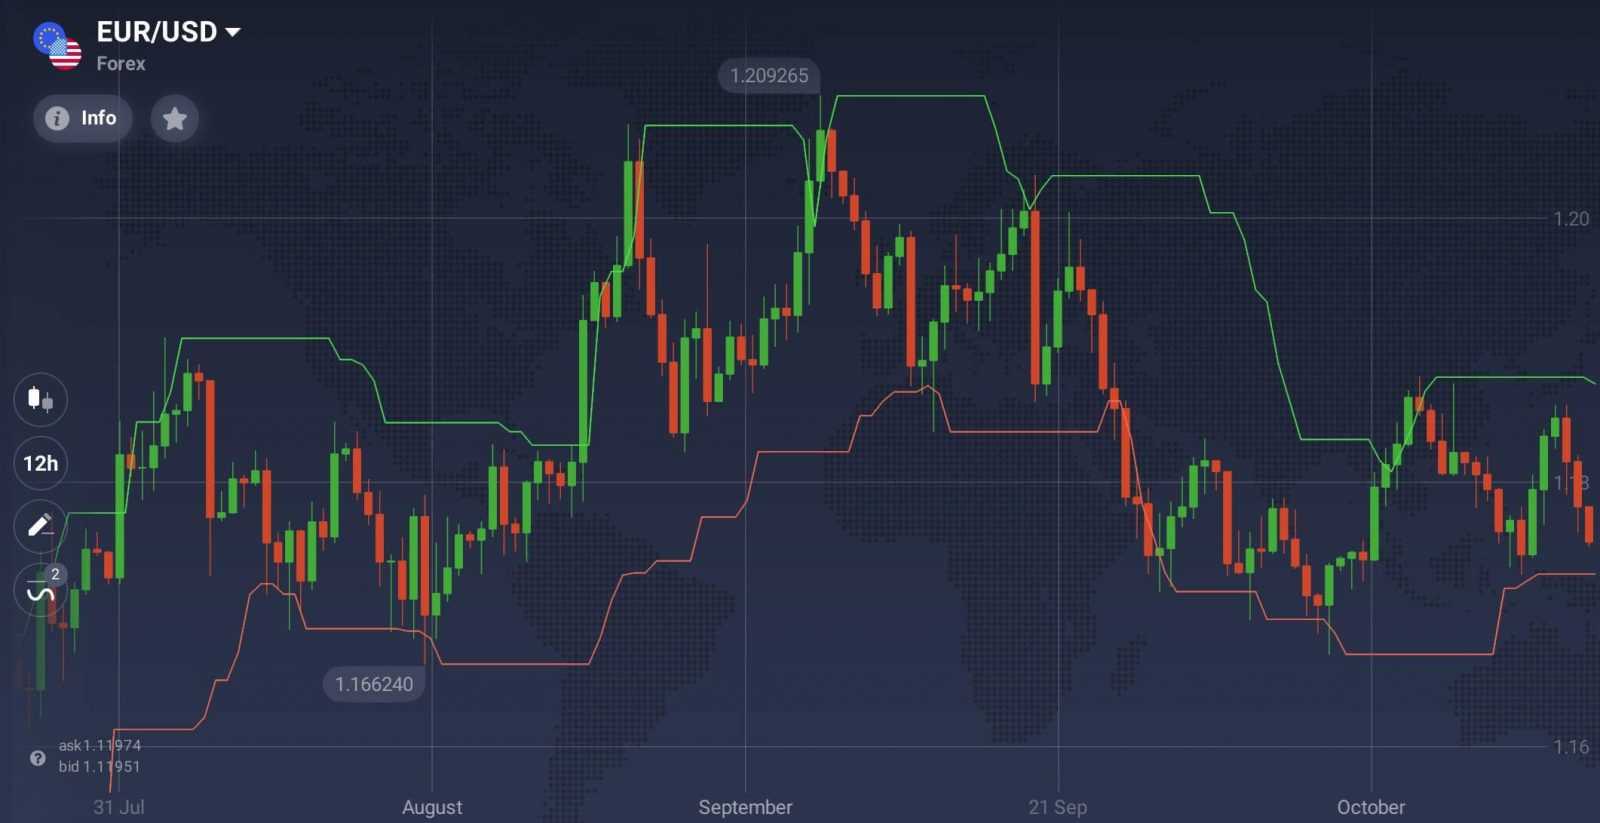
Highest High and Lowest Low are two technical analysis indicators that do exactly what they say: plot the highest and the lowest asset price over the price chart in the form of two lines.
These two simple yet effective indicators can turn into a powerful trading system when combined. The two can be used on their own or as a supportive tool, that confirms or refutes the signals sent by different indicators. They can hint at potential reversal points, help you estimate the probability of a trend reversal and the likeability of a sudden price move.

The idea behind the indicators is not only similar but also quite simple. Highest High returns the highest price observed over the course of several periods. Lowest Low, in its turn, shows the lowest price observed over the number of periods. You can adjust the number of periods when setting up the indicator. The longer the period, the longer the last observed highest/lowest price will dominate the chart. This is true for both indicators.
How to use it in trading?
How exactly would one use Highest High and Lowest Low in trading? Due to their nature, Highest High and Lowest Low are perfectly suited to serve as a dynamic price channel. A price channel is a corridor inside which the asset price will move while the current trend is prevalent. When the trend changes, the price channel will follow. Usually, the price channel is confined by two parallel lines. Certain indicators — like this one — can create price channels of their own.
One way to use the indicators is as follows. When the price fluctuates within the price channel, the trader would observe and wait for a trading opportunity to present itself. When the price, however, leaves the price channel, one of the two can be expected: 1) it will either continue moving in the same direction, setting new highs or lows, 2) or it will rebound and return back to the channel. Now, to the tricky part. It is not always easy to tell which one will happen once the price action reaches Higher High / Lower Low lines. It is up to you to learn to distinguish between a breakthrough and a rebound, the difference that can make or break a lot of deals.

When expecting a rebound, traders might consider opening a BUY position when the price actions crosses the lower (red) line and a SELL position when the price action crosses the higher (green) line. When expecting a breakthrough and the continuation of a strong trend, traders might consider opening a BUY position when the price actions crosses the higher (green) line and a SELL position when the price action crosses the lower (red) line.
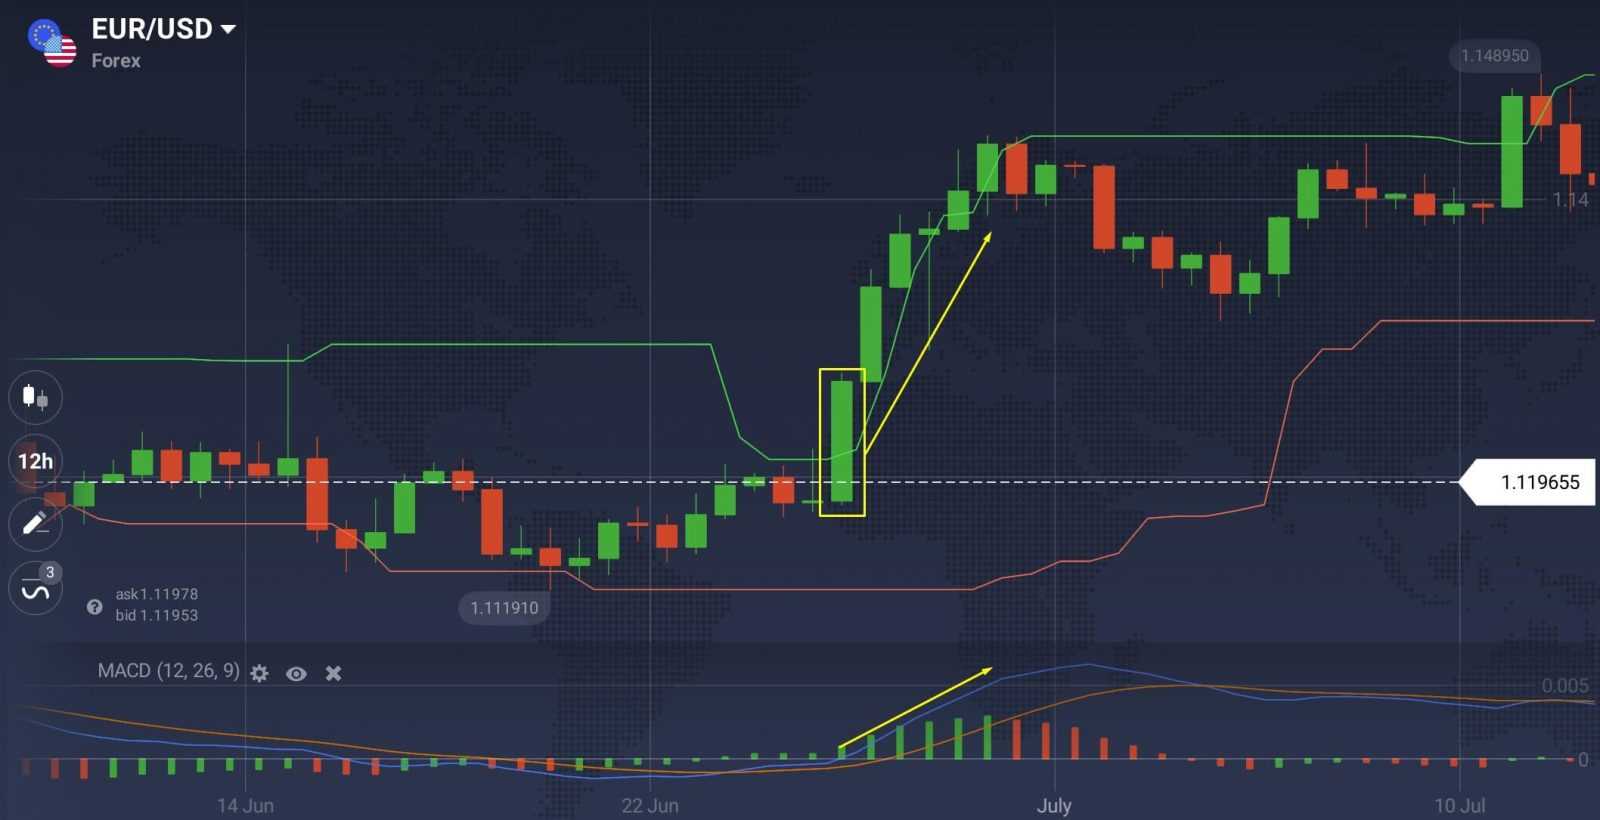
As you can see, the actions taken by traders in both cases are the exact opposite. It is crucial, therefore, to tell a rebound from a breakthrough. But there is one thing that might help: a confirmation. When spotting a candle that closes on one of two lines, you might consider waiting for two more candles to close in order to receive a confirmation. Judging by these two candles it might be easier to estimate the future price movement.
As stated above, it is also possible to combine Highest High and Lowest Low with other technical analysis tools. No matter what you use, try to find something that goes together well. Something like Trading Volume, MACD and ADX can work just fine (try to use indicators that are not plotted on the price chart directly, otherwise they will obscure your vision). You may consider opening the deal when all indicators point to the same outcome and do not contradict each other.
At the same time, you should remember that these are just indicators, and as any technical analysis tool, they cannot provide accurate results 100% of the time. Sometimes they might (and will) provide false signals. That’s why it is always a good idea to double check the signals you receive from Highest High and Lowest Low with the help of other indicators.
How to set up?
You can easily set up the indicators by following these steps:
- In the trade room, click the ‘Indicators’ button in the bottom left-hand corner,
- In the ‘Other’ tab choose Lowest Low from the list of available options,
- Repeat the two previous steps for Highest High,
- Your trading system is ready to use!
Now, when you know how to set up and use Highest High and Lowest Low in trading, proceed to the trading platform and give them a try!

