The New Zealand trade balance figures missed the mark, unexpectedly widening, and indicative of poor activity on the island nation. This is at first glance a bit shocking and seems to confirm a recent survey of business conditions but is belied by the internal data. Yes, the headline deficit widened by 16% versus an expected decline but that widening does not reveal surprise increases in both exports and imports.
The volume of exports came in at 4.63 billion. This is above the expected 4.61 billion and shows growth from the previous month’s 4.56 billion. Growth in exports was offset by imports which is why the headline balance came in weaker than expected. Imports came in at 5.82 billion, well ahead of the 5.10 expected and the previous month’s 5.43 billion.
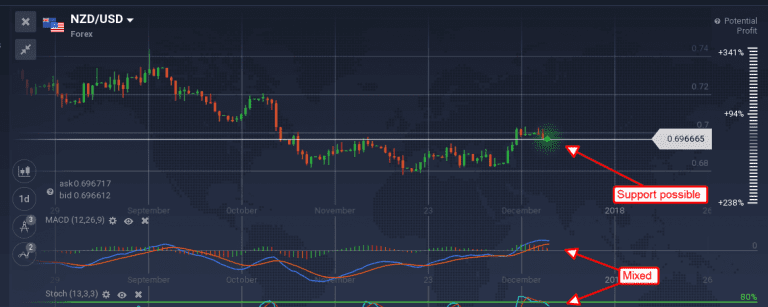
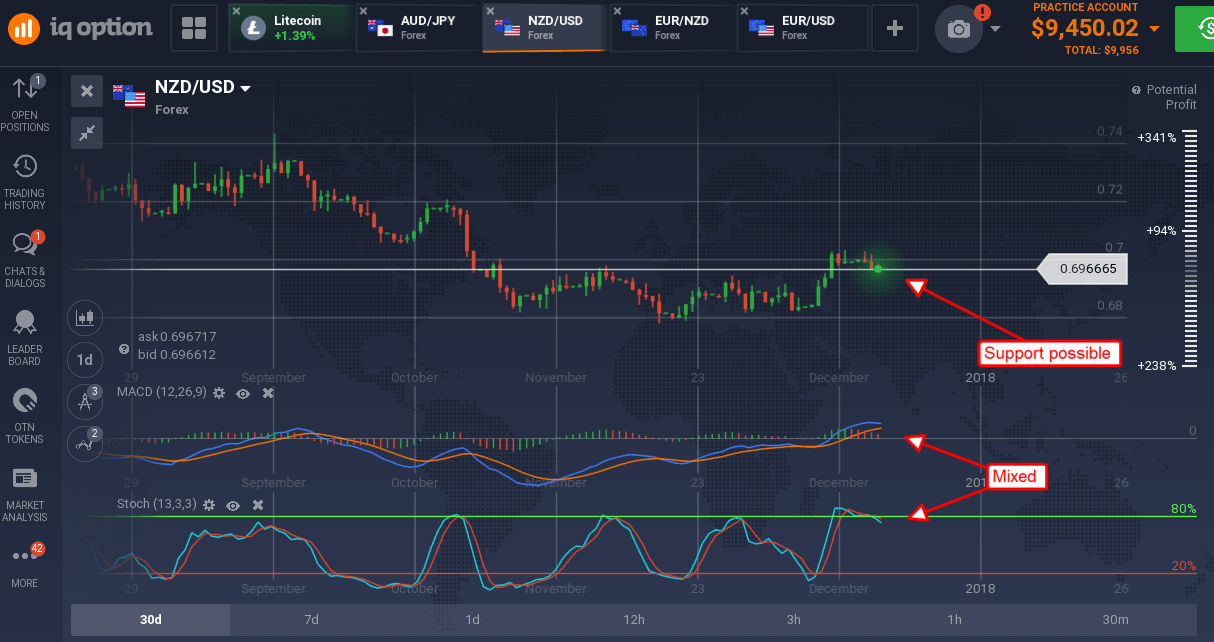
The data did little to strengthen the Kiwi versus the greenback, but it did help it find support. The NZD/USD moved lower in early trading but found support near 0.6975. This level is near the top of a short-term trading range and the possible base line of a head & shoulders reversal pattern. If confirmed this new support could lead to significant upside with target near 0.7200. Weaker than expected US data, or just data that does not support a tightening of FOMC outlook, will likely help this pair move higher. There is risk the pair could remain range bound, a fall from this level would confirm that with a likely target for support near 0.6800.
The NZD lost some ground to the Euro as well, but those losses were capped by weaker than expected PPI from Germany. While still expanding above the ECB’s 2% target rate that expansion has slowed to 2.5% from the previous read of 2.7% and faster than expected. Looking to the ECB it does not give them much reason to tighten.
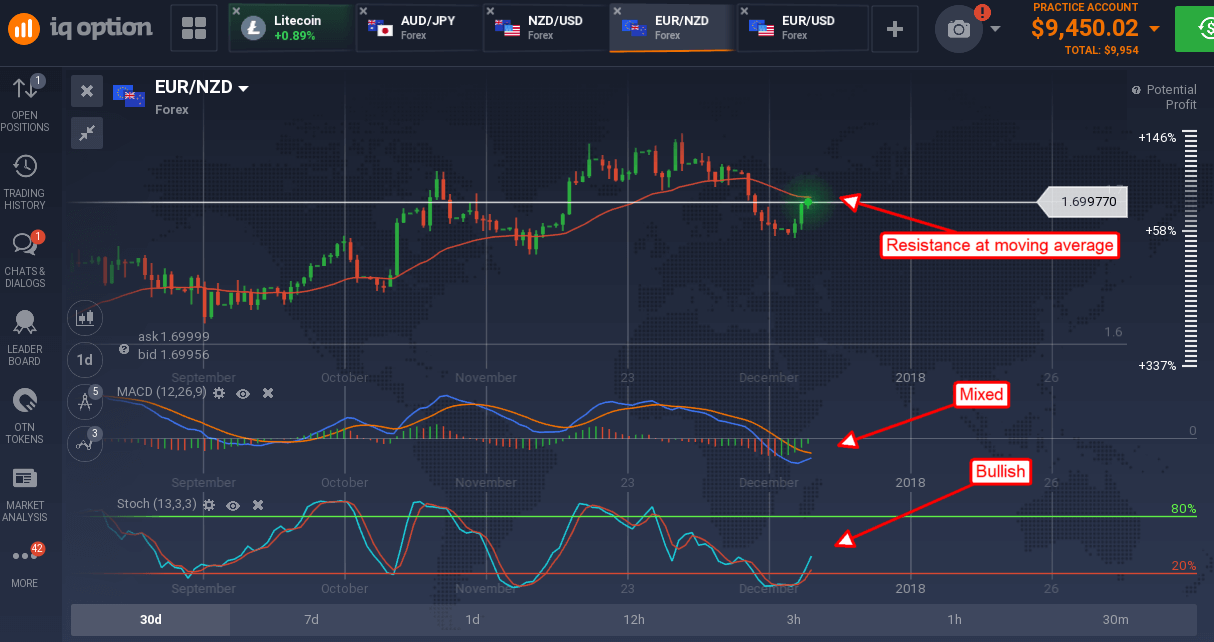
The EUR/NZD moved up on the news, but the move was small and capped at the moving average. The indicators are bullish/becoming bullish, so a test of the MA is likely, near the 1.700 level. A break above it would be bullish with upside target near 1.7500.
The EUR/USD continues to wind up within its range although bias is shifted to the upside. The pair is moving up off the short term moving average, from the midpoint of a short-term trading range, and indicated higher. The move is driven by a slackening of FOMC policy outlook offset by a similar stance from the ECB.
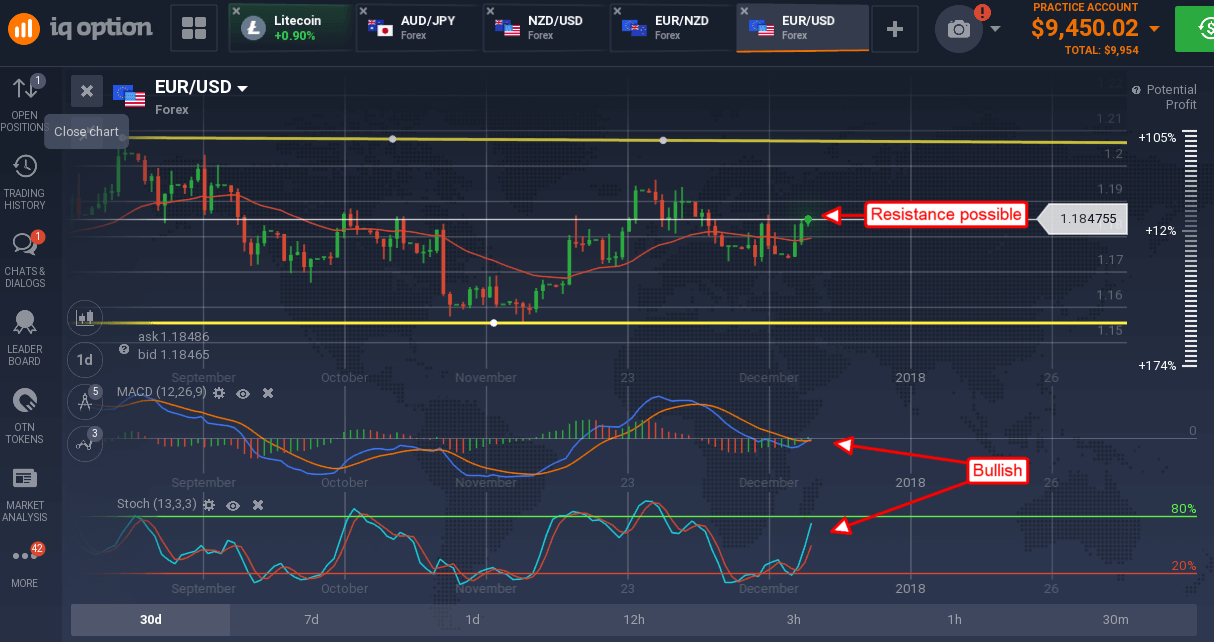
The changes in outlook have left the pair range bound with a chance US tax reform could be the catalyst to break it out; so far no-go on that event. There may be resistance at the 1.18500 level, a break above there would be bullish with target near 1.1975.
