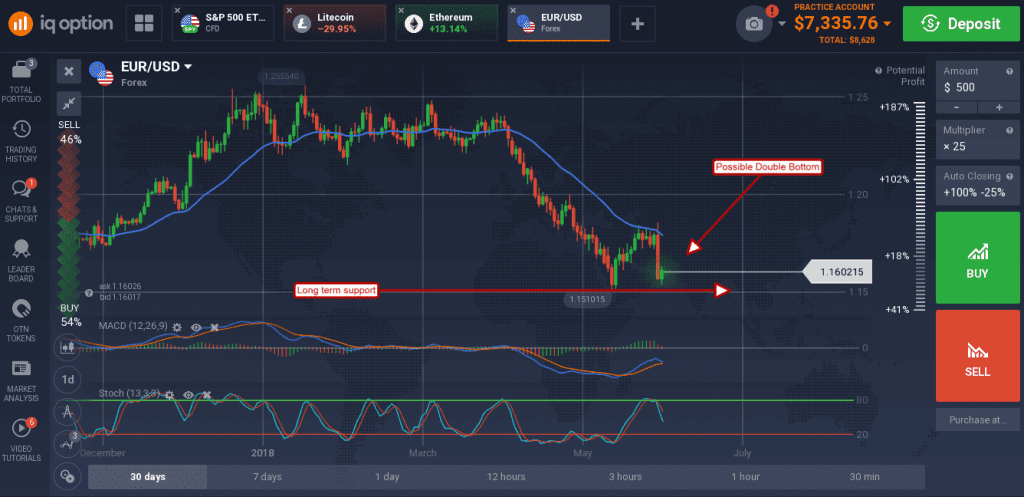
On Thursday the ECB tanked the euro on a softer than expected stance regarding inflation and the end of QE. On Friday consumer level inflation in the EU points to higher prices and the need for action if not now then soon. The combination has left the EUR/USD sitting on a long-term support line where it has begun to bounce, bringing the possibility of a double bottom reversal into play.
The all-EU consumer price index rose to 0.5% in May. This figure is as expected and shows acceleration from the previous month that will eventually lead to an ECB rate hike. The year over year figure was also as expected holding steady at 1.9% and just shy of the 2% target favored by the ECB and FOMC. At the core level inflation gains are tamer but still present. Core CPI rose to 0.3% from the previous 0.2% and held steady at 1.1% YOY.
The Euro responded by regaining some of the strength it lost on Thursday. The EUR/USD is moving up of support, a support level that is higher than the one set last month and setting up for one of two things. The first is a move down to retest last month’s low and possibly continue the downtrend which has dominated prices during 2018. The second is completing a reversal which began with last month’s bounce from the low. Considering the fact, the FOMC is on track to reach an end to their tightening cycle and the ECB has just begun I’d say the second scenario is far more likely.

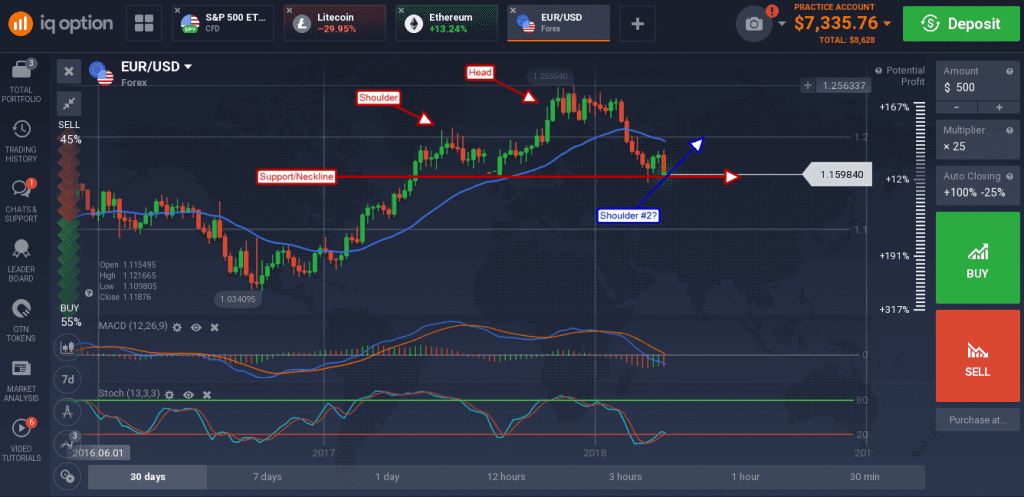
The weekly chart shows the pair testing support at 1.1600. This level is consistent with a low set in 2017 and the baseline of what could become a major, long-term, head & shoulders reversal. If so, the pair is set-up to move higher and form the second shoulder, an outlook consistent with reversal on the daily chart. The indicators are mixed in that MACD is bearish and stochastic bullish but together give indication a shift in momentum is happening.

The caveat is that this move and central bank outlook will come down to the data as it always does. Mario Draghi left the ECB a gaping back-door, tying actual end of the asset purchases to the data, and may talk dovish up to and until the bank surprises the market with a rate hike. On the FOMC side, if the inflation data doesn’t cool in the next month or two it is very possible the bank will move forward with plans to hike two more times this year, or even surprise with a larger than expected 50 BPS hike in the fall. Regardless, key support is now 1.1540 on the daily charts.

