Ichimoku Cloud indicator, also known as Ichimoku Kinko Hyo, is a technical analysis instrument that belongs to the category of trend indicators. With the appropriate Ichimoku Cloud settings, it may help identify the direction and reversal points of the prevailing market trend.
Being quite versatile, Ichimoku can also work as an oscillator. That is to say, it determines the speed of the price change for a given asset. As if it were not enough, Ichimoku is also capable of locating support and resistance levels.
As you can see, this versatile tool has the potential to become a great foundation for any trading approach. Keep reading to find out how to choose the Ichimoku Cloud settings and learn about different ways to apply this tool in trading.
How to Read this Indicator?
To give an illustration of what Ichimoku Cloud is, let’s break it down into separate elements. There are five elements in total and each one is a different kind of moving average.
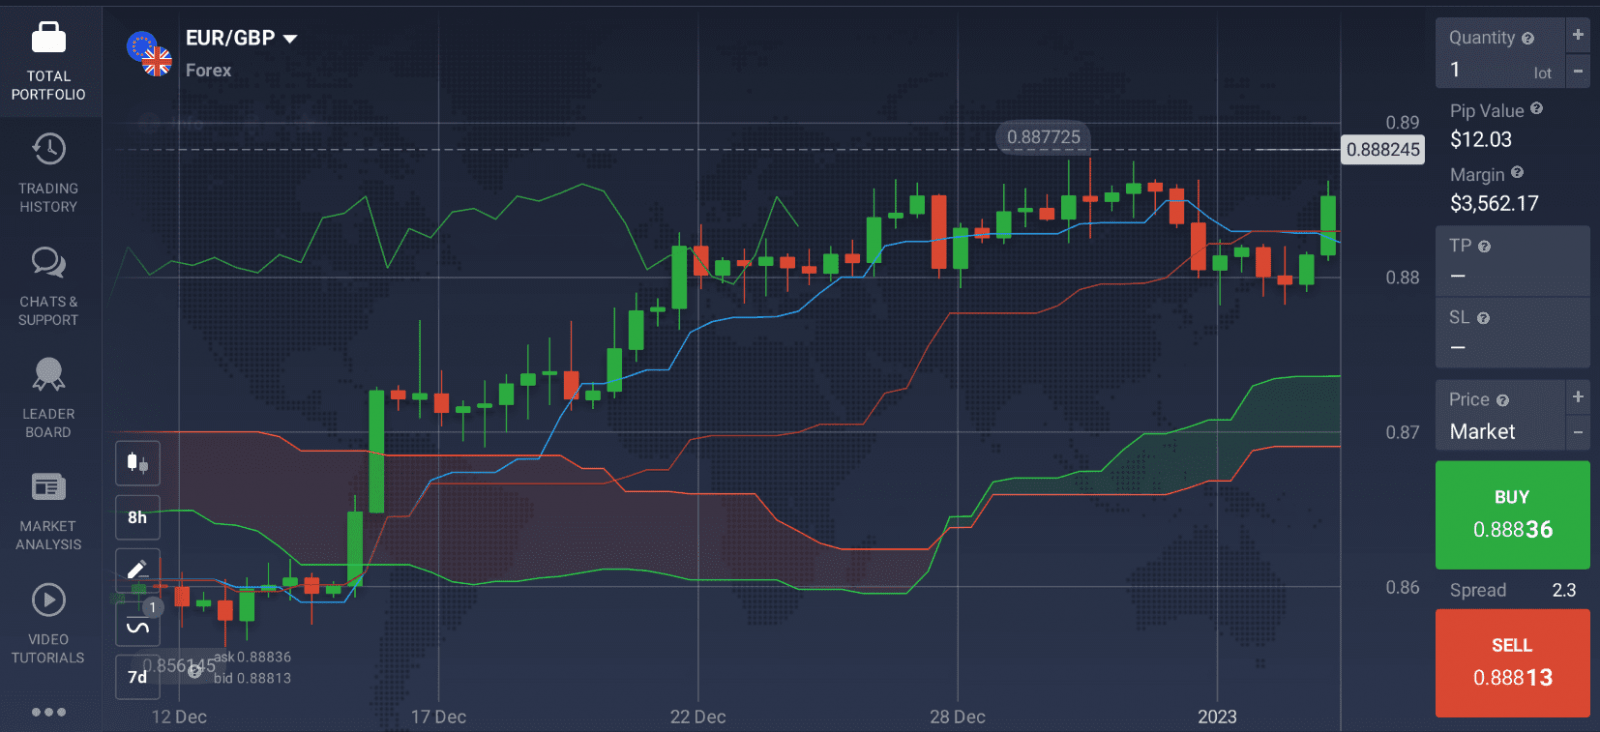
The conversion line Tenkan (blue) and the standard line Kijun (red) are also called equilibrium lines. The conversion line (blue) averages the highest high and the lowest low for the last 9 periods. It may point to an upcoming trend reversal when crossing the standard line (red).
In comparison, the standard line averages the highest and lowest values for the last 26 periods. It serves as a dynamic support and resistance level.
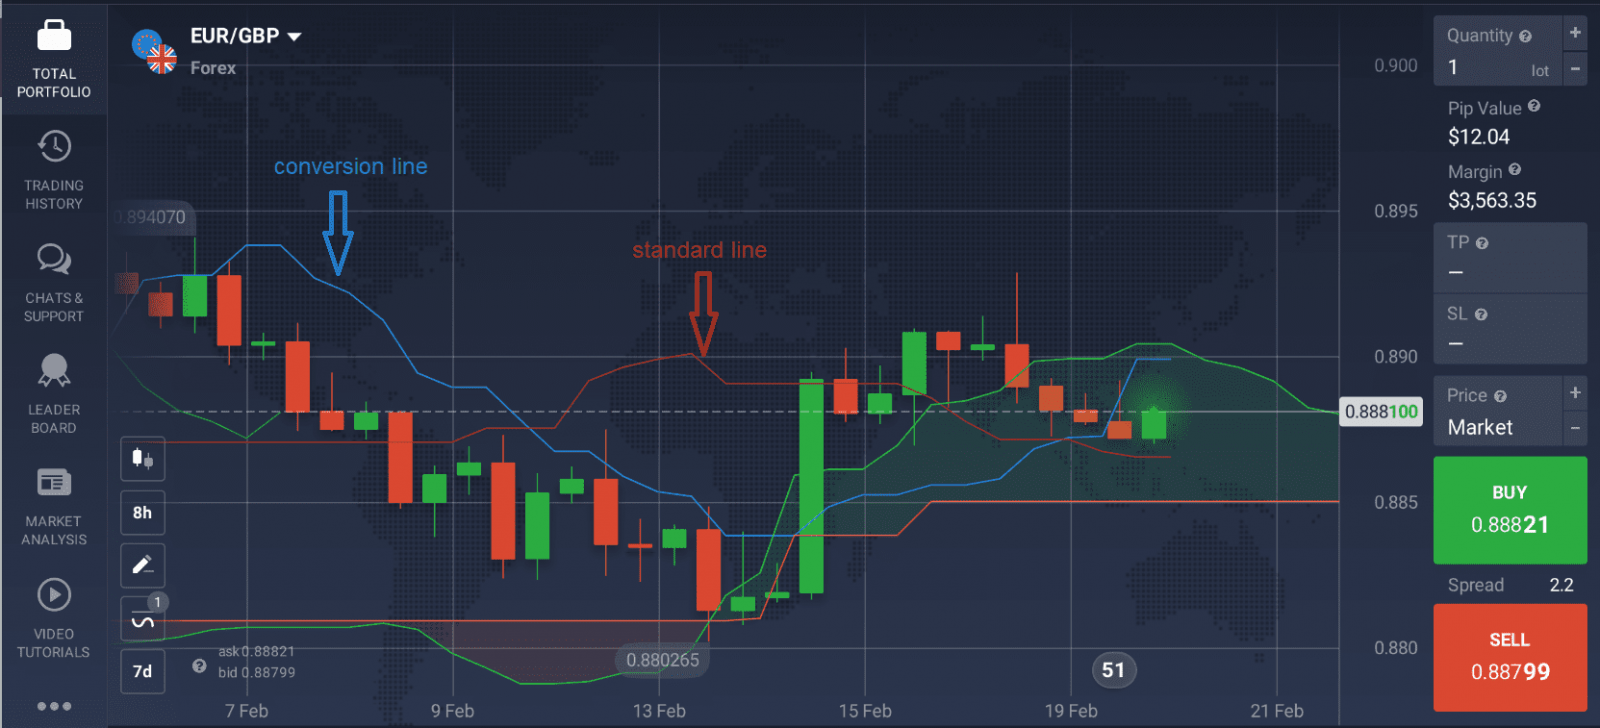
The second pair of moving averages Senkou Span A (light green) and Senkou Span B (orange) form the so-called cloud (the shaded area on the price chart). Senkou Span A averages the two equilibrium lines and shifts the derived values 26 periods ahead. Senkou Span B averages the highest high and the lowest low for the last 52 periods, shifting the results 26 periods forward.
✍️
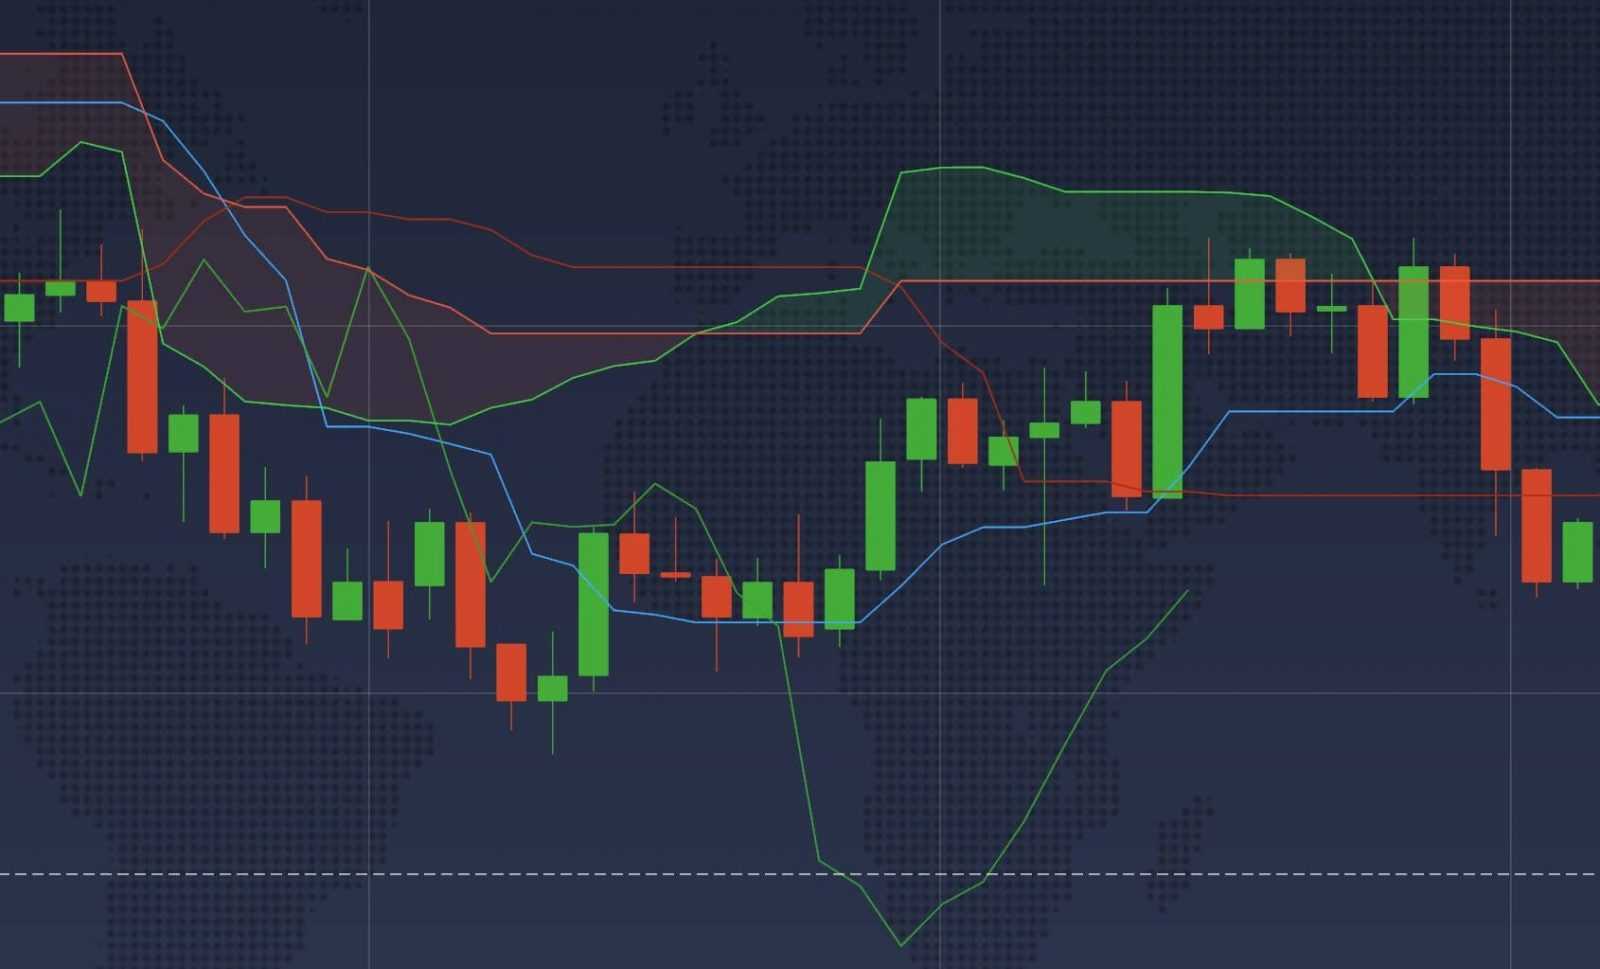
When the cloud turns green, overall sentiment on the market may be considered as bullish. Conversely, when the color becomes red, market sentiment might be considered as bearish. The vertical distance between the borders of the cloud may serve as an indicator of the market volatility.
Finally, the Chikou Span (green-colored line) represents the closing price of the current candle, which is shifted back by 26 periods. This lagging moving average serves as an aid to confirm other signals received by this indicator.
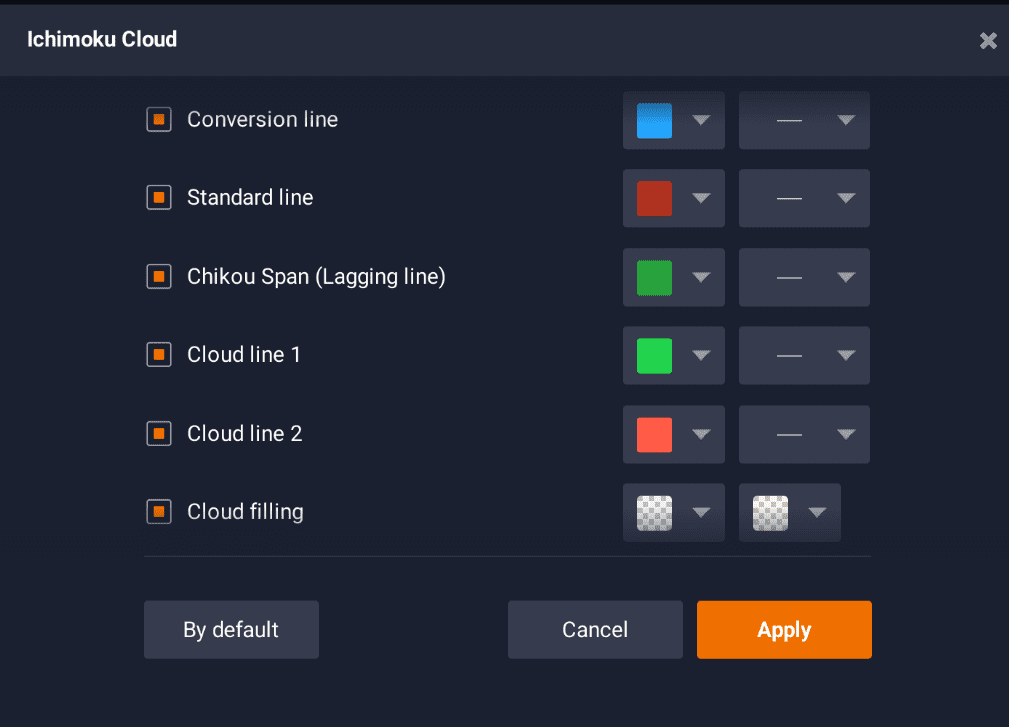
Ichimoku Cloud Settings
So, how to set up Ichimoku Cloud indicator? Let’s cover the main steps.
- To choose the Ichimoku Cloud settings, go to the ‘Indicators’ menu by clicking the corresponding button in the bottom-left corner of the screen.
- Go to the ‘Trend’ tab.
- Choose Ichimoku Cloud indicator from the list and click apply to use the standard settings.
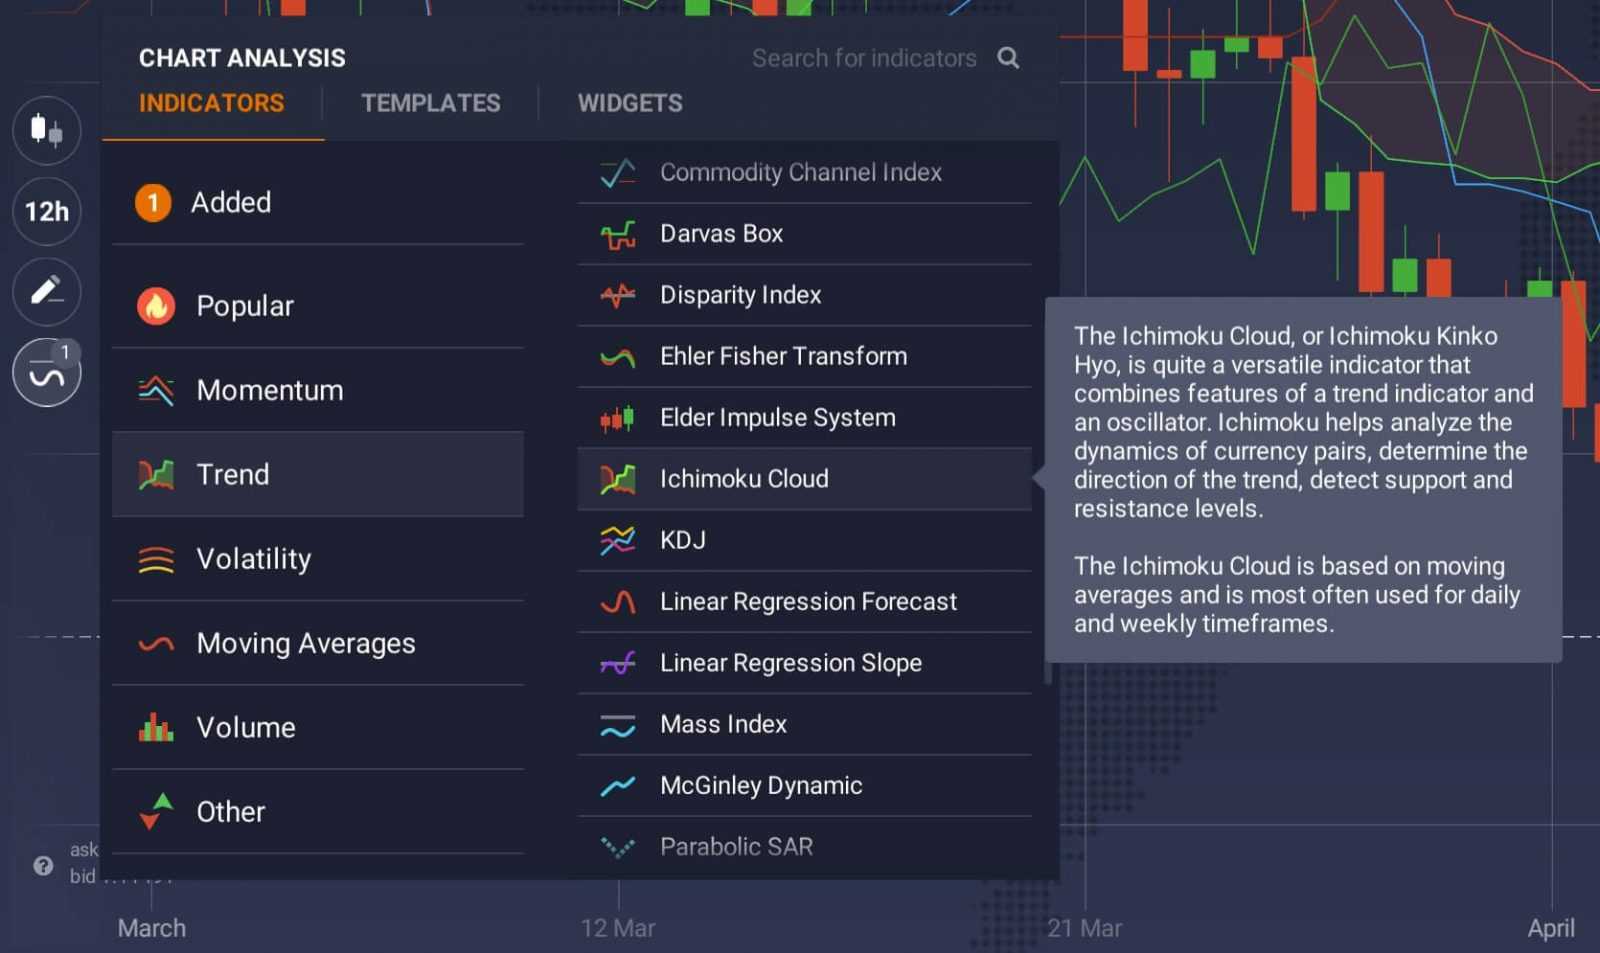
That’s it! You can change the settings for Ichimoku Cloud indicator or remove it from the chart by going back to the ‘Indicators’ icon.
How Accurate is the Ichimoku Cloud?
The Ichimoku cloud indicator may point to a bullish trend if the following signs are observed:
- The candles appear above the cloud;
- The cloud turns from red to green,
- The candles move above the Kijun line (red);
- The Tenkan conversion line (blue) moves above the Kijun line (red).
On the other hand, a bearish trend may be coming up, if:
- The candles move below the cloud;
- The cloud turns from green to red;
- The candles move below the Kijun line (red);
- The Tenkan conversion line (blue) moves below the Kijun line (red).
Keep in mind that no indicator may offer a 100% accurate result. Professional traders may prefer to combine Ichimoku Cloud indicator with other tools for more precise analysis.
