
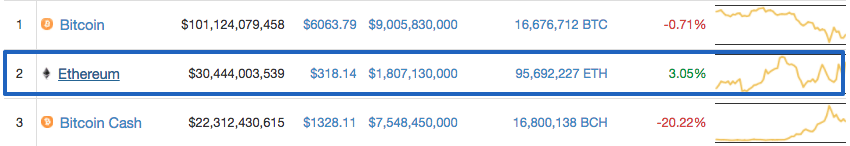
This week, though for a short while, Bitcoin Cash surpassed Ethereum to be the second largest coin according to the market cap. With the sudden boost, BCH/USD almost doubled its value. But the soon dropping BCH again put bullish ETH in the second spot. Currently, Ethereum is holding that position firm with over $30 billion market cap. The trading volume of the ETH also shot up with last 24-hours trading volume over $1.8 billion.
Key Highlights:
- ETH/USD pair gained 6 percent over the week with a lot of ups and downs and finally trading around $310
- Against Bitcoin, Ethereum also gained 6 percent week-on-week and is currently trading at 0.052 BTC
Last week ETH had a lot of ups and downs against US dollar. In the early week, a steep upward rally took ETH/USD value from $288 to $326 in little more than 48 hours. But the strong resistance level above $327, resulted in a dip and ETH/USD value nose-dived to $290. But the coin had a lot of support in the $290-$297 regions, with the former acting as a pivot. At the same time, the pair faced a lot of resistance between $315 and $319. Even after testing those levels multiple times, ETH/USD could not breach the resistance.
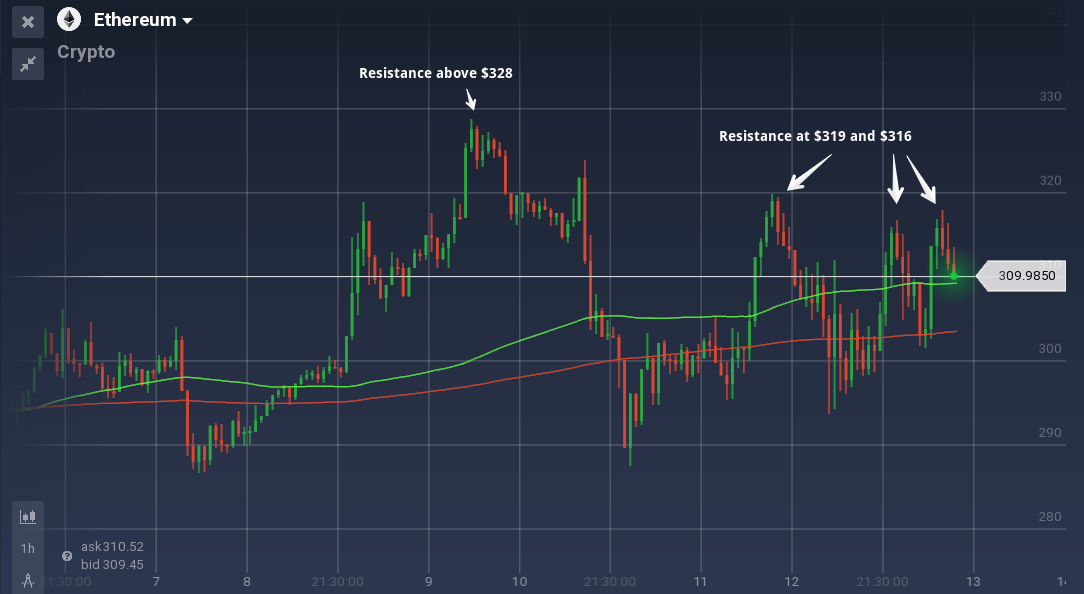
In the daily chart, ETH/USD retracted from the $297 level and tested the $316 resistance level couple of times. But the resistance level could not be breached, and the pair is currently trading around $310.
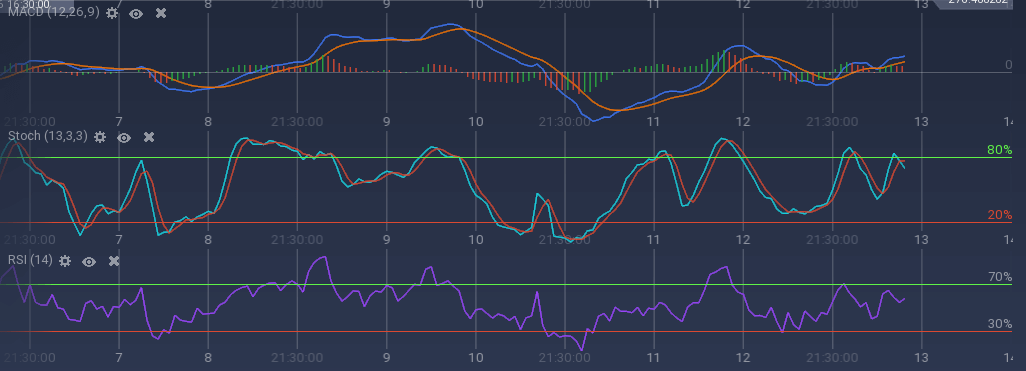
The oscillators are indicating a bullish trend. 100 SMA is running above 200 SMA indicating the path of least resistance to be upward. MACD curve is also showing a bullish trend. RSI is currently at 58 percent.
Because of the falling Bitcoin and rising Ethereum, ETH/BTC had a great week. Though in the early week, the pair dipped from 0.053 BTC to 0.046 BTC, ETH/BTC eventually gained an upward momentum which it maintained from the rest of the week. With 6 percent appreciation over the week, ETH/BTC is currently trading at 0.052 BTC.
