The Woodies CCI indicator is an advanced technical analysis tool. Its most distinctive feature is that it may feel more like a complete trading system than a single indicator. This means that the Woodies CCI trading system can be used on its own, unlike other indicators that might require confirmation from other technical analysis tools. So let’s dive in to answer the question “What is the Woodies CCI indicator?” and learn more about its set-up and application.
What is the Woodies CCI indicator?
When we say that Woodies CCI indicator is a trading system of its own, we mean that it effectively incorporates several different tools. Woodies CCI is a combination of 5 basic elements: the CCI, the CCI Turbo, the CCI Histogram, the base line and support/resistance lines.

The CCI
The CCI, also known as the Commodity Channel Index, is the most important part of this trading setup. It’s represented by a red line on the chart. The default period setting on IQ Option is 14.
The CCI itself is an oscillator-type indicator. It measures the difference between an asset’s price change and its average price during a certain period of time. When the CCI indicator line is going up, it may show that the asset price is above average. Conversely, when the indicator line is decreasing, the asset price might be trending down.
If you’d like to learn more about this specific tool and its application, head over to this material with a detailed review and examples of possible trades: Trading with the Commodity Channel Index.
The CCI Turbo
The CCI Turbo is just a regular CCI with a shorter period. You may see it as a green line on the chart. The default period setting on IQ Option is 6.
The CCI Histogram
The CCI Histogram is the second part of this trading system. When the trend is positive, the histogram appears above the zero line. When the trend is negative, it moves below the zero line.
The colour of the histogram bars is determined by the previous performance of the CCI. When the indicator stays above the zero line for 6 bars and longer, the following bar turns green. When the indicator stays below the zero line for 6 bars and longer, the following bar turns red.
The base line
The base line, or zero line, may be viewed as a neutral point on the chart, with the indications above it considered positive, and below — negative.
Support and resistance lines
These line point to the oversold and overbought levels. By default, they are set at ± 100. You may adjust these values in the settings menu depending on your goals and preferences. Traders may also choose different colours for these elements in the indicator settings.
The combination of these 5 tools creates the Woodies CCI trading system. Let’s now have a look at its possible applications and set-up.
How to use the Woodies CCI Indicator?
Now, to the most interesting part. There are several types of indications that traders may look for when working with this tool.
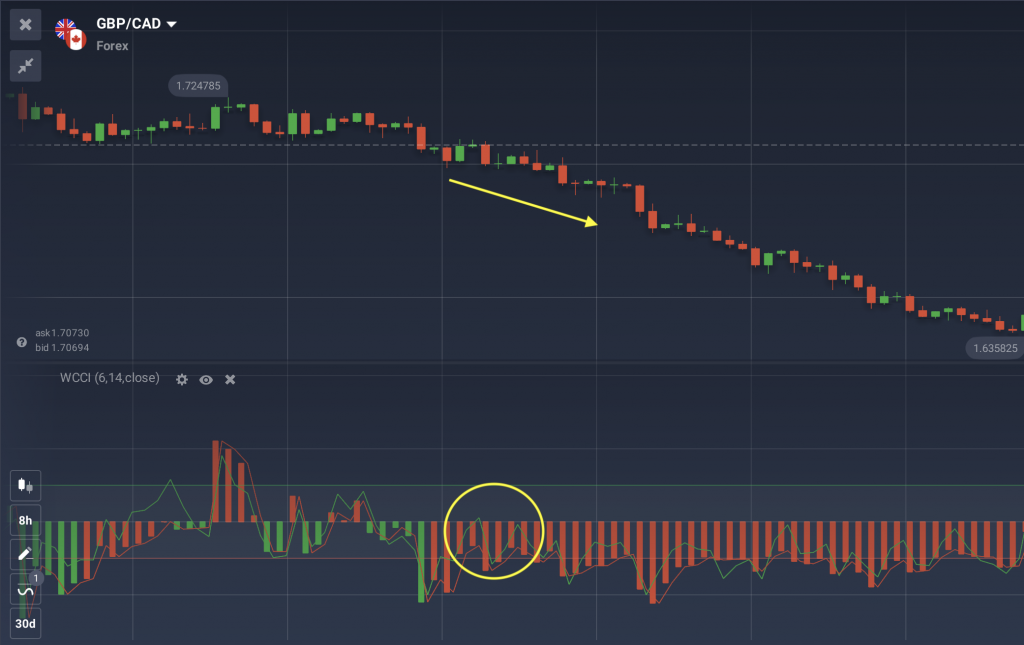
1. Zero-line Reject
The zero line is an important threshold that separates a negative trend from a positive one. It might assist traders in identifying one of the most popular Woodies CCI indications.
When the CCI line gets close to the zero line during a strong trend and then bounces off in the opposite direction, it may point to the emergence of a new trend. This might indicate a potential opportunity for an entry based on the prevailing trend direction.
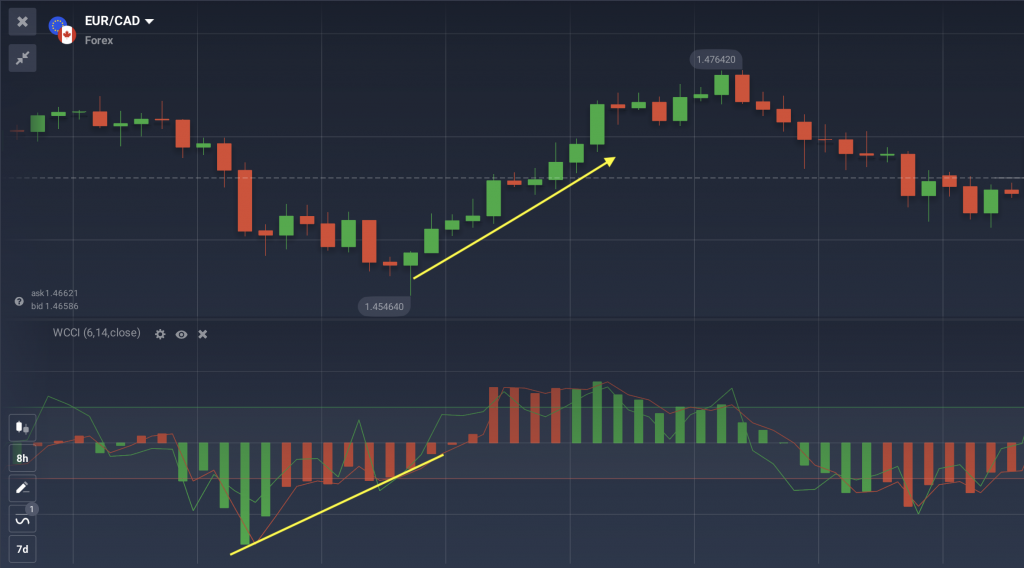
2. Reverse Divergence
This might appear when there are peaks and troughs on the CCI histogram that can all be connected by a straight line. The straight line should be pointing at zero. Such an occurrence might indicate that a strong trend in the direction of the straight line can be expected.
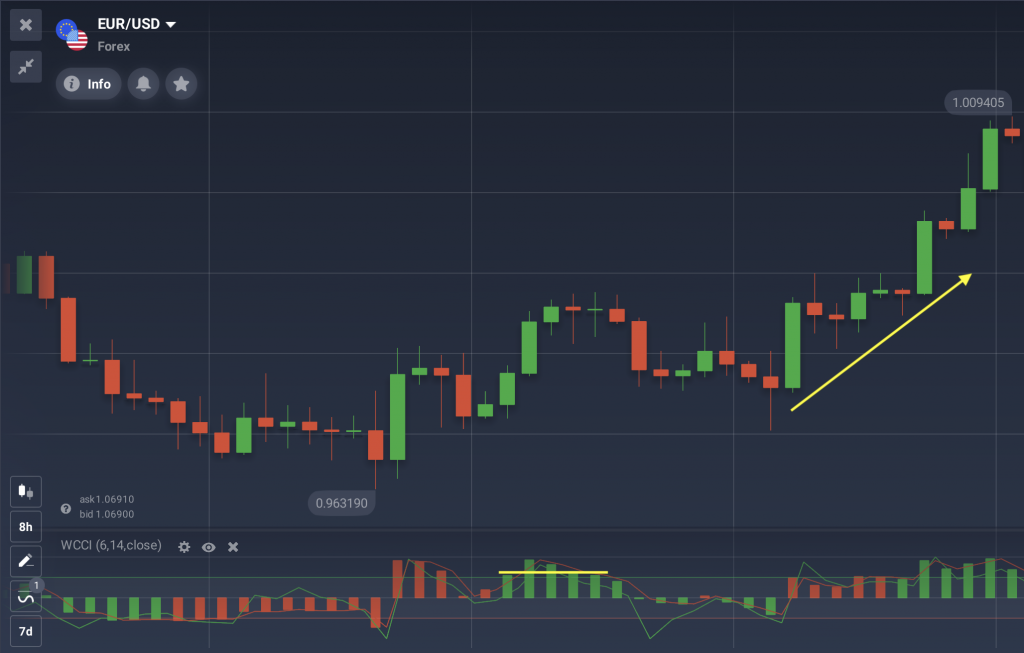
3. Horizontal Trend Line Break
When two CCI peaks or troughs are located on the same level close to the support or resistance lines, it might point to an upcoming entry opportunity.
Considering that the Woodies CCI trading system might seem complex at the start, you may need some time and practice to use it properly. It might be wise to test this tool on the free IQ Option demo account before moving on to real funds. Once you grasp the basic principles of trading with Woodies CCI indicator, it might become an important part of your asset analysis.
How to set up the Woodies CCI indicator?
To choose the indicator settings, go to the ‘Indicators’ section of the IQ Option traderoom and find Woodies CCI in the ‘Momentum’ tab.
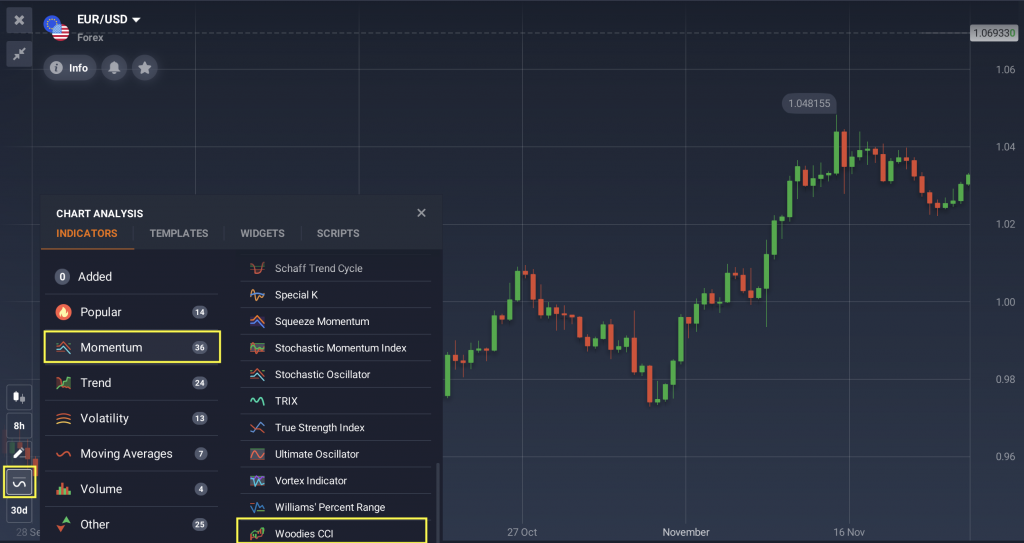
You may adjust the settings of different elements within the Woodies CCI trading system. These include the colours, periods, as well as the values of the support and resistance levels. Some traders might choose to apply the default parameters, while others adjust the settings to their personal needs and goals. So it is totally up to you.
You should remember that no indicators can provide 100% accurate indications.
Ready to proceed to the platform and give this indicator a try?
The Company offers CFDs.
