The US Dollar (USD) inched lower against the Japanese Yen (JPY) on Wednesday, dragging the price of USD/JPY to less than 111.50 ahead of the US Pending Home Sales news. The technical bias remains bullish because of a higher low in the recent upside move.
US Pending Home Sales
The National Association of Realtors (NAR) is due to release the Pending Home Sales Report today during the US trading session. According to the average forecast of different economists, the pending home sales increased by 2.4% in February as compared to 2.8% decline in the month before.

The pending home sales report measures the change in the number of homes under contract to be sold but still awaiting the closing transaction, excluding new construction.
A higher than expected reading should be taken as positive/bullish for the USD, while a lower than expected reading should be taken as negative/bearish for the USD.
How to Trade today’s Home Sales Data?
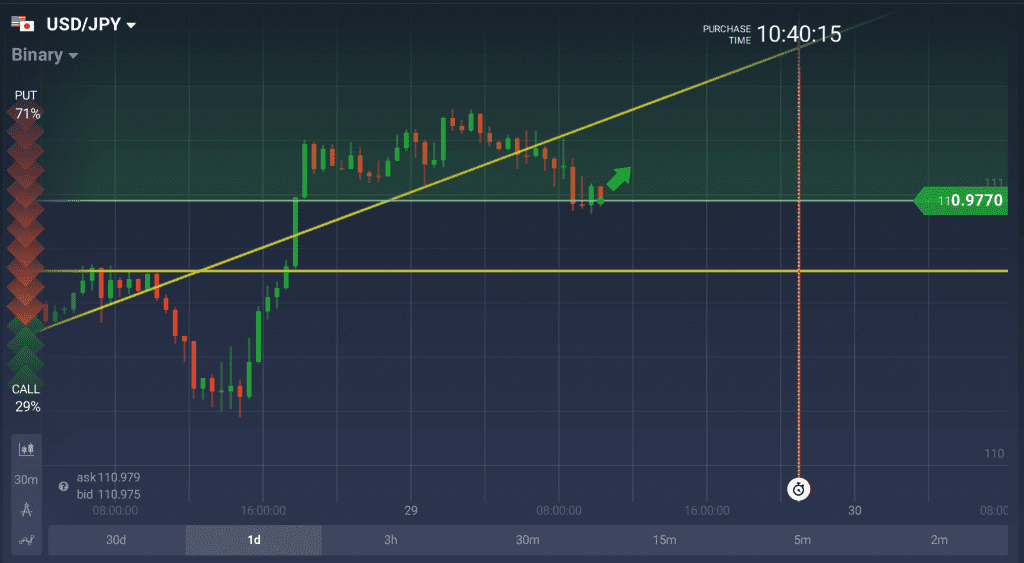
- Buying the USD/JPY call options may be a good strategy if the pending homes sales date comes better than forecast.
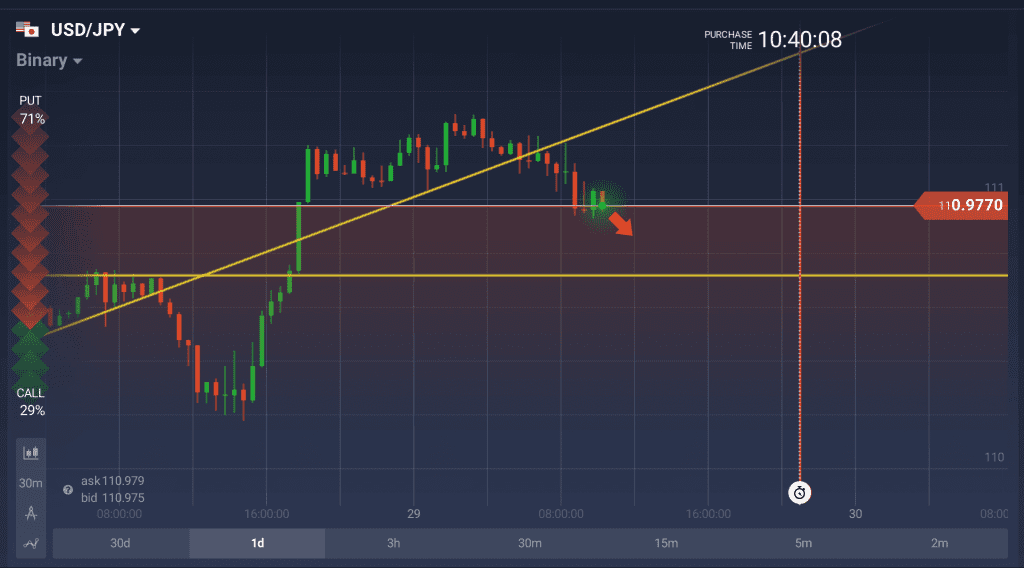
- Alternatively, buying the USD/JPY put options may also be a good strategy if the home sales data misses the average projections of economists.
Technical Analysis
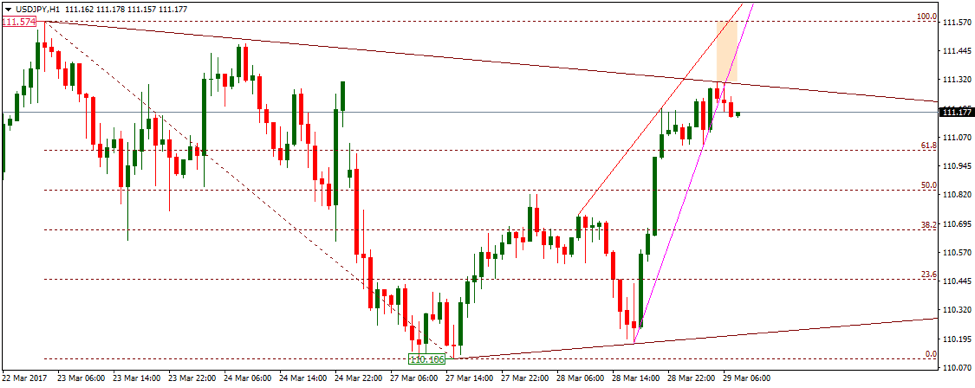
As of this writing, the pair is being traded around 111.20. A support may be seen near 111.00, the 61.8% fib level + psychological number ahead of 110.85-110.75, the short term horizontal support + 50% fib level and then 110.19, the lower trendline support as demonstrated with brown color in the given below hourly chart. A break and daily closing below the 110.19 support shall incite renewed selling pressure, validating a move towards 109.50 and then 109.20.

On the upside, the pair is expected to face a hurdle near 111.30, the trendline resistance area ahead of 111.46, another trendline resistance as demonstrated with pink color in the above chart and then 111.57, a major horizontal resistance zone. The technical bias shall remain bullish as long as the 110.19 support area is intact.
How USD/JPY Reacted on Past Homes Sales Releases?
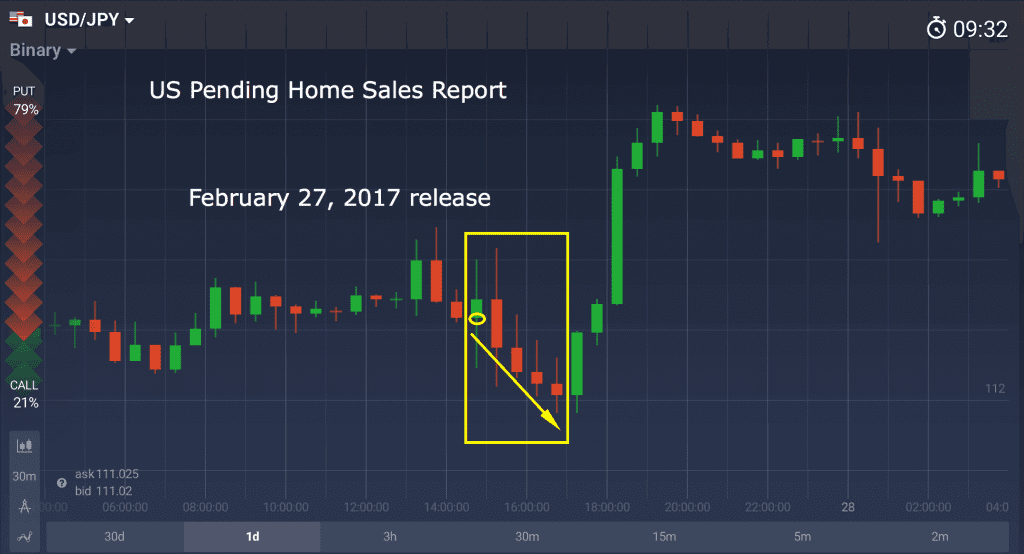
USD/JPY fell by almost 40 pips after the release of last pending home sales data on February 27th, 2016. According to the report, the pending home sales declined by 2.8% as compared to the forecast of 0.8% increase.


The pair however didn’t show any noticeable movement after the release of December’s pending home sales report. The report showed 0.8% decline in pending home sales as compared to 1.1% increase.


