Support and resistance are the most important price levels in your trading. Read on to learn how use them to your advantage and add them to your arsenal of trading skills.
The most important price levels
The most important price levels are the ones at which you can make money, right? Joking aside, the most important price levels are the ones at which the market thinks it can make money, or the ones at which the market thinks an asset is oversold, overbought, or just right. The good news is that these price levels are more or less easy to spot when you know what to look out for.
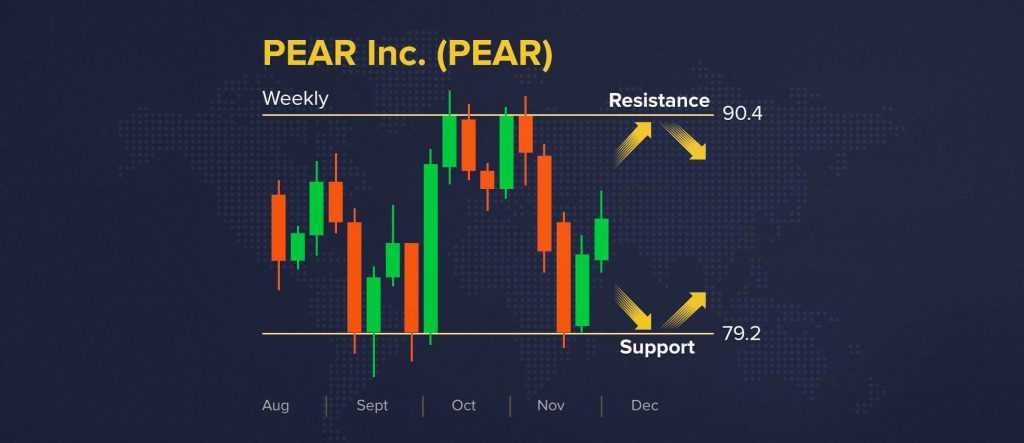
Each time the price stops, reverses or moves sideways is an important level for the market. Once such an occurrence is noted on the charts, it can be expected to affect price action into the future. Anytime prices approach, bounce from, or pass through these levels, they become a tradable event.
- Support and resistance can be seen in the peaks, troughs, and consolidations within the market.
In common parlance, these levels are referred to as support and resistance. Support is when the price level is below the asset’s price. The idea is that there are market participants waiting to buy in at the level, preventing further decline and lending their “support” to prices. Resistance is when the price level is above the assets price. Here, the idea is that traders are waiting there to sell and will prevent any further advance. They are resistant to higher prices. To mark these levels, simply use the Horizontal Line in the Graphical Tools found in the lower left of the IQ Option charts.
The trick, of course, is knowing which of the many lines of potential support and resistance are the strongest — the ones you should be using to trade. The strongest lines are always drawn on the higher time frame charts. In my personal opinion, the daily charts are a fine place to start for short term, day to day, and swing trading. Any peak and trough you see is a possibility, but the strongest support and resistance are levels that have been tested more than once. You can use support and resistance lines on shorter time frames; they work great there too.
How do you trade Support and Resistance?
The way you trade them is simple. In an uptrend, as prices rise toward resistance, one of two things will happen: a bounce or a break through. If prices reach that resistance and begin to give off bearish candle signals and/or fail to move above it, it’s likely prices will reverse and dip lower. If prices reach the resistance line and begin form a continuation pattern and/or give off bullish candles, they will likely break through. Because we’re talking about an uptrend, it is inadvisable to enter into bearish trades too soon. That is, if prices are going to reverse, they will likely retest the resistance at least once before making a major move lower. Likewise, if prices do breakthrough in a sign of continuation, they are also likely to retest that resistance as new support before moving higher.
The same is true in a down trend. When prices reach a line of potential support, they will either break through, or bounce from it. The trick, as with the uptrend, is to wait for the price to reach that level and begin giving off its signals. If the price does not move below the line, or if it begins making bullish candles at the line, you can expect prices to bounce. Likewise, if the price does falls below the line and/or begin making bearish candles you can expect prices to break below and drop lower.
Practical examples of trading with Support And Resistance
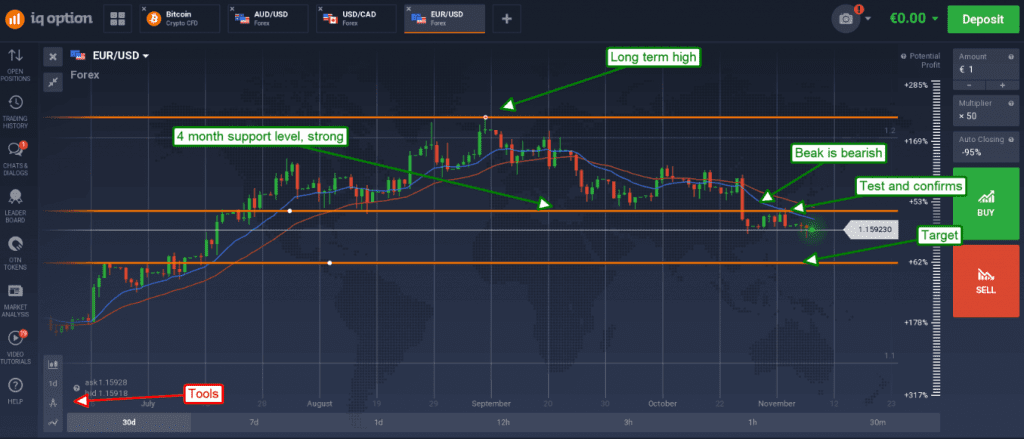
Below you will find a EUR/USD chart with three support/resistance lines. The top most line is drawn at a multiyear high, the middle line is drawn at support level that was tested multiple times over a period of four months, and the lower line is a target support line consistent with a small consolidation/continuation pattern set earlier in the year. Prices approached the middle support target in late October, but instead of bouncing as expected, they fell through, giving off signs of bearish indication. You could enter put trades or go short the pair at this point, but it is better to wait for the confirmation. A few days later prices retreat to test support turned resistance and then fall again, confirming the orignal bearish signal.
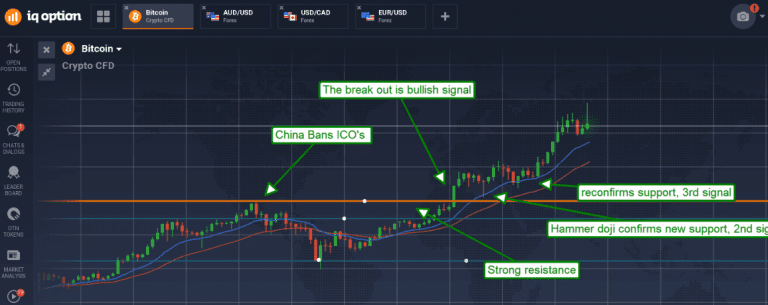
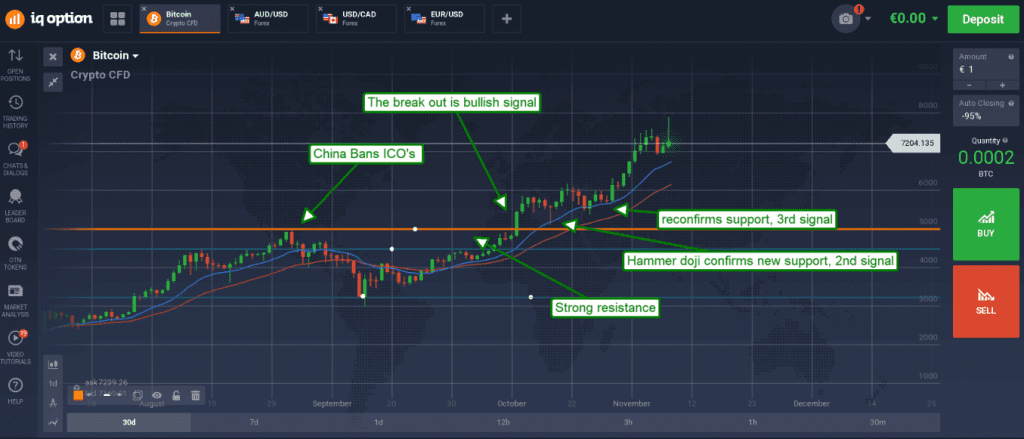
This next chart is Bitcoin. It shows the sharp decline following China’s ban of initial coin offerings (ICOs) and the resistance formed by it. It also shows prices moving back to test this resistance and having a breakout. The first candle is tradable but not always the best action to take, unless you can catch it as it is happening. The better trade is to wait for the retest of resistance turned support which occurs just a few days later. In this instance, there are 2 more attractive entries after the first that are both tradable.
This next chart is the USD/JPY, which is in a long-term trading range. The pair has recently trend up to test resistance at the top of the range but is throwing off bearish candlesticks. Resistance is also confirmed in both MACD momentum and stochastic, suggesting that prices will drop a bit lower.
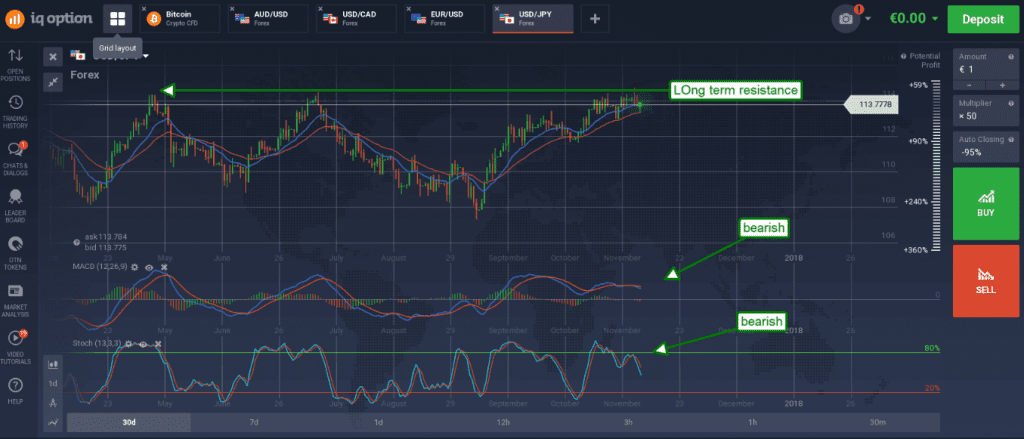
In this case, in the absence of a further test of resistance, a drop below the moving averages would trigger bearish trades.
