
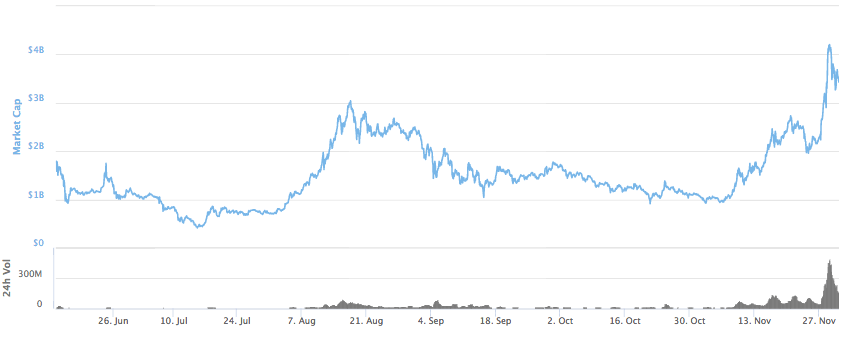
With their new blockchain tech, IOTA has offered clients some pretty unique features like zero fees, infinite scalability, fast transactions, secure data transfer, quantum-proof cryptography, etc. Their network also has no transaction fees. With a jump in the value of IOT/USD this week, the market cap of this coin again crossed an all-time high above $4 billion, but with a drop in the value, the market cap currently settled around $3.4 billion.
Key Highlights
- MIOTA reached an all-time high above $1.50 with a steep bullish run
- Resistance around the peak are pushing the price down, but multiple support levels are trying to keep it stable
- IOT/BTC gained 50 percent over the week and currently trading at 0.00012 BTC
In the weekly chart, the token started with a downward motion until it found support at $0.69. In the midweek, the token’s value jumped with some consecutive buying rage. Though it faced some resistance around $1.16, the high demand didn’t bother the coin too much as it had another buying rage.
Ultimately the token reached an all-time high value above $1.50. But due to high resistance at the peak, the token took a downturn. Though multiple pivots tried to push it up, no one succeeded until the coin found some resistance around $1.1 to $1.3.
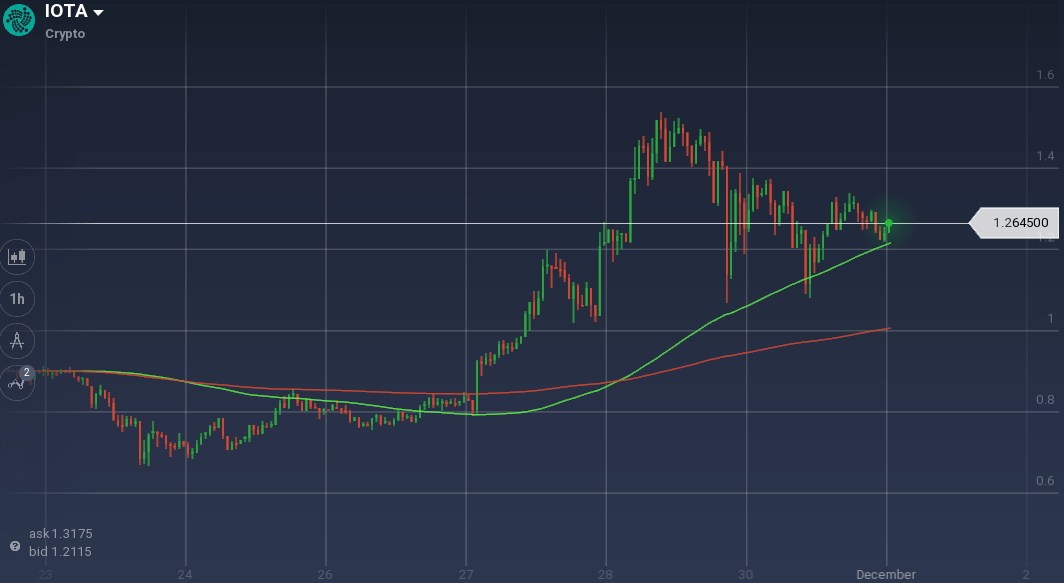
In the daily chart, the token started the run by dipping to $1.1 where the support level also acted as a pivot. The token reached $1.3 until it faced some resistance.
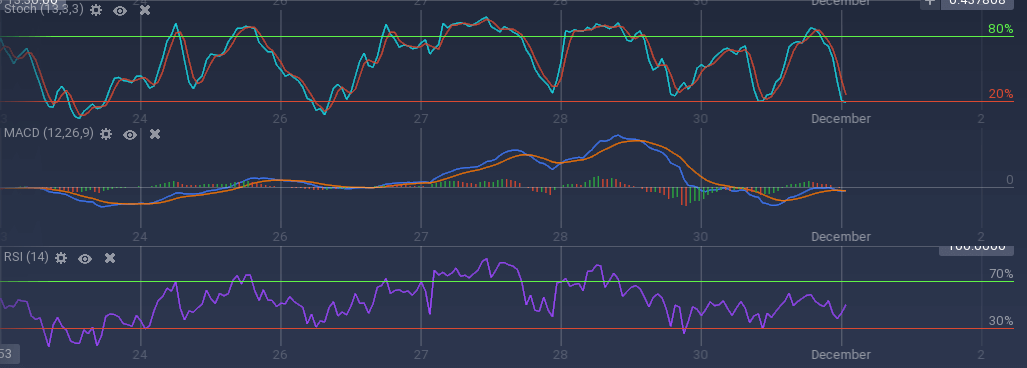
Because of the recent resistance levels, the technical indicators are recently pursuing a bearish run. MACD is running flat below the axis and signaling a bear. Stoch is going down and reached the 20 percent overselling mark.
But it is indicating to take a U-turn upward. RSI is at 47 percent. Due to the jump in the value in the midweek, 100 SMA went on the top of 200 SMA indicating an upward least resistance. Fibonacci retracement is at 38.2 percent.
Against Bitcoin, MIOTA had a good performance this week. The token reached 0.00012 BTC form 0.00008 BTC. This is a 50 percent appreciation over the week.
