Candlesticks are great tools, if you have done any amount of trading you know that. Within the candlestick world reversal patterns are among the best you can find. Within that subset is a pattern that does appear that frequently, is comprised of only two candles, and can lead to much larger movements than what you might see with other short-term signals.
Now, when I say short I mean a signal that forms over the course of 2 or 3 days, or 2 or 3 candles, versus one that forms over a week or a month, or over the course of 30 or more candles. The first type, short term, will lead to moves that last for a few candles while those of the second may lead to moves that last for many candles. The Tweezer Pattern kind of falls in between the two, it is a sort of medium term candle that forms when prices become over extended, a condition ripe for reversal.
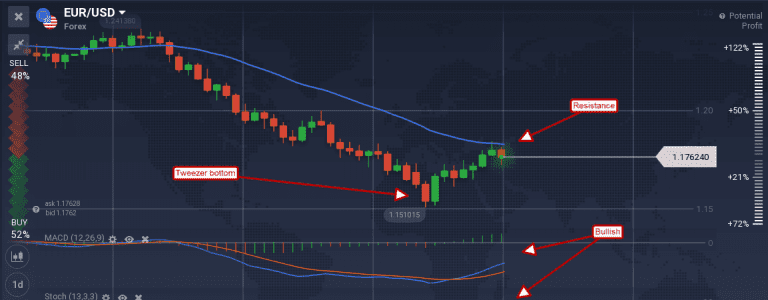
What is the Tweezer Reversal? It is when two candles form side by side and, in the case of a bull reversal, the first is red and the second is green. The first candle moves down to set a new low and test support. It forms a medium to long red candle with visible lower shadow, this is the first have of the tweezer. The second candle opens at the close of the first, or very close to it, tests support and then moves up strongly to pierce or engulf the first. This is the second half of the Tweezer with the two lower shadows forming the pincer. Together they show capitulation met with buying, the last sellers have left, and the first buyers stepped right in to clean up the mess.
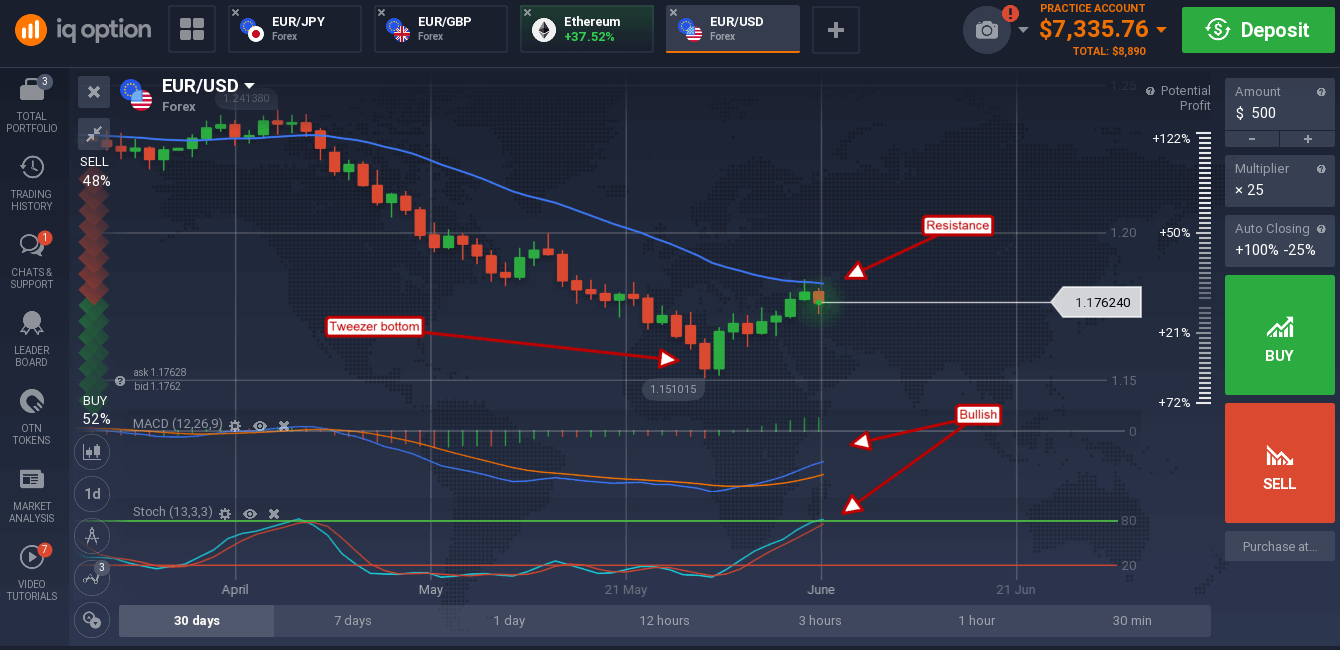
Trading it is easy, if you spot the conditions before or while it is forming. In this case you can enter bullish positions, or bearish if it forms at the peak of a rally, as soon as the second candle closes. The target for profit taking would be any resistance targets you have projected based on past price action. In the chart above that means the long-term low (the tweezer formed on the breach of that low) and then the short term moving average once that low is surpassed. In the chart below this means the bottom of the trading range (the support level was breached when the tweezer formed) and then targets within the range on the way up to the top.
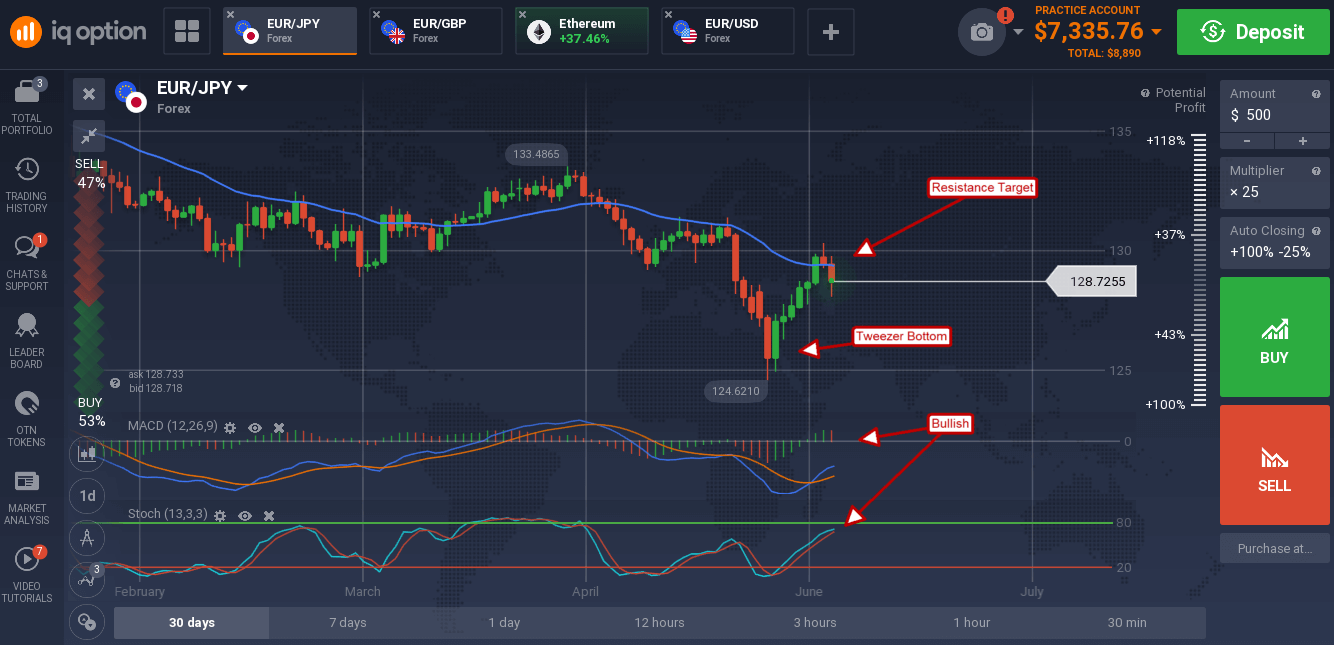
Trading the tweezer reversal after it forms is also simple. In the case of bull reversal wait for confirmations of support and other commonly used bullish trend-following indications. In the case of these charts the move is driven by ECB hawkishness that could continue to lift prices into the intermediate term, an opportunity for savvy traders.
