
On one hand, analysts widely emphasize the importance of technical analysis in Forex trading. But on the other hand, it is commonly understood that no method can guarantee 100% success. So, does Forex technical analysis work, really?
In this article, we explore several real-life examples of applying basic technical analysis tools on the IQ Option platform to understand the data they provide and evaluate their reliability in trading decisions.
What’s Forex technical analysis?
Forex technical analysis is a method traders use to predict potential future currency price movements based on past market data.
☝️
However, information regarding past performance is not a reliable indicator of future performance.
Types of Forex technical analysis tools
Essentially, technical analysis involves examining charts and using special tools. Traders may use this information to attempt to predict where currency prices might head next.
Now, let’s review some common types of technical analysis in Forex.
Technical indicators
Technical indicators are calculations based on a currency pair’s price, volume, or other trading data. The IQ Option platform features over 100 technical indicators that might give insights on currency pair’s momentum, trend direction, volume, volatility, etc. You can find detailed descriptions of various platform indicators here.
Some well-known indicators include the Moving Averages, which smooth out price data to show trends, the Relative Strength Index (RSI), which helps determine if prices are very high or low compared to the past, etc.
Lines
Lines on charts help connect price points to show patterns like support and resistance levels.
For example, trend lines connect various prices to show the general direction a currency is heading, while horizontal lines mark price levels where the market often changes direction. Fibonacci lines are commonly used to identify retracements — short-term price movements that move against the general trend.
Candlestick patterns
Candlestick patterns are shapes on a chart formed by price movements within a certain period. They give clues about market mood and where prices might go next.
For example, a Doji pattern suggests that traders are undecided, while a Bullish Engulfing pattern might indicate that prices are set to rise.
If you’re new to pattern analysis, check out our article on 4 candlestick patterns everyone should know.
Widgets
Widgets are extra on-platform tools that add more features or information. The IQ Option platform’s widgets for Forex CFD trading include:
- Trade Volume — shows what amount of the selected currency pair was sold and bought within a certain period of time. The higher the volume, the higher the interest in the asset at its current price, and vice versa.
- Traders’ Sentiment displays the Buy/Sell ratio for the selected asset.
- High and Low Values widget provides quick insights into the price range of a particular asset during a specified time frame: from 1 hour to 12 months. For example, if set to “1 day,” it will show the peak and the bottom prices that the asset achieved within the current trading day.
Now, let’s have a look at some common tools on the IQ Option platform to understand how to trade CFDs on Forex using technical analysis.
CFD Trading with Forex technical indicators
As an example, we will attempt to identify a trend reversal, since capturing a trend at its turning point may give a trader a possible advantage.
Spotting trend reversals with Moving Averages
Let’s begin by using a basic technical indicator — the Moving Average. Since a single Moving Average isn’t effective at identifying trend reversals, we’ll employ a Double Moving Average. Here’s how it works:
- Setting up two Simple Moving Averages: one with a period of 10 (red) and another with a period of 20 (blue).
- Monitoring for a crossover. You may watch for the point where the two Moving Averages cross over each other.
- Opening a trade at the crossover in the direction opposite to the prevailing trend. For example, if the market is bullish, you may press “Sell”, and vice versa — if the market is bearish, you may press “Buy”.
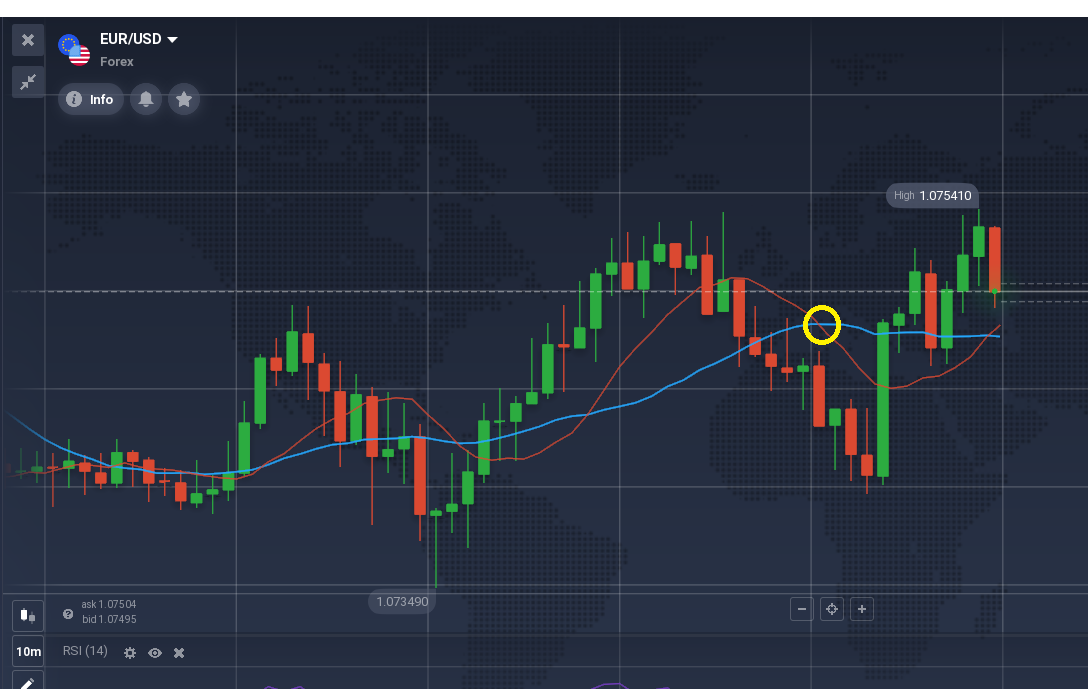
In this exact trade, the indicator’s cue was confirmed by the chart — the bearish trend did reverse into a bullish one. But how reliable is it really?
To determine this, let’s analyze the same chart on a 1-day timeframe and see how often the crossover genuinely indicated a trend reversal versus how many times it was inaccurate.
For a clearer visualization, we have drawn white trend lines connecting the highest and lowest points on the chart, illustrating the directions of the trends throughout the chosen day.
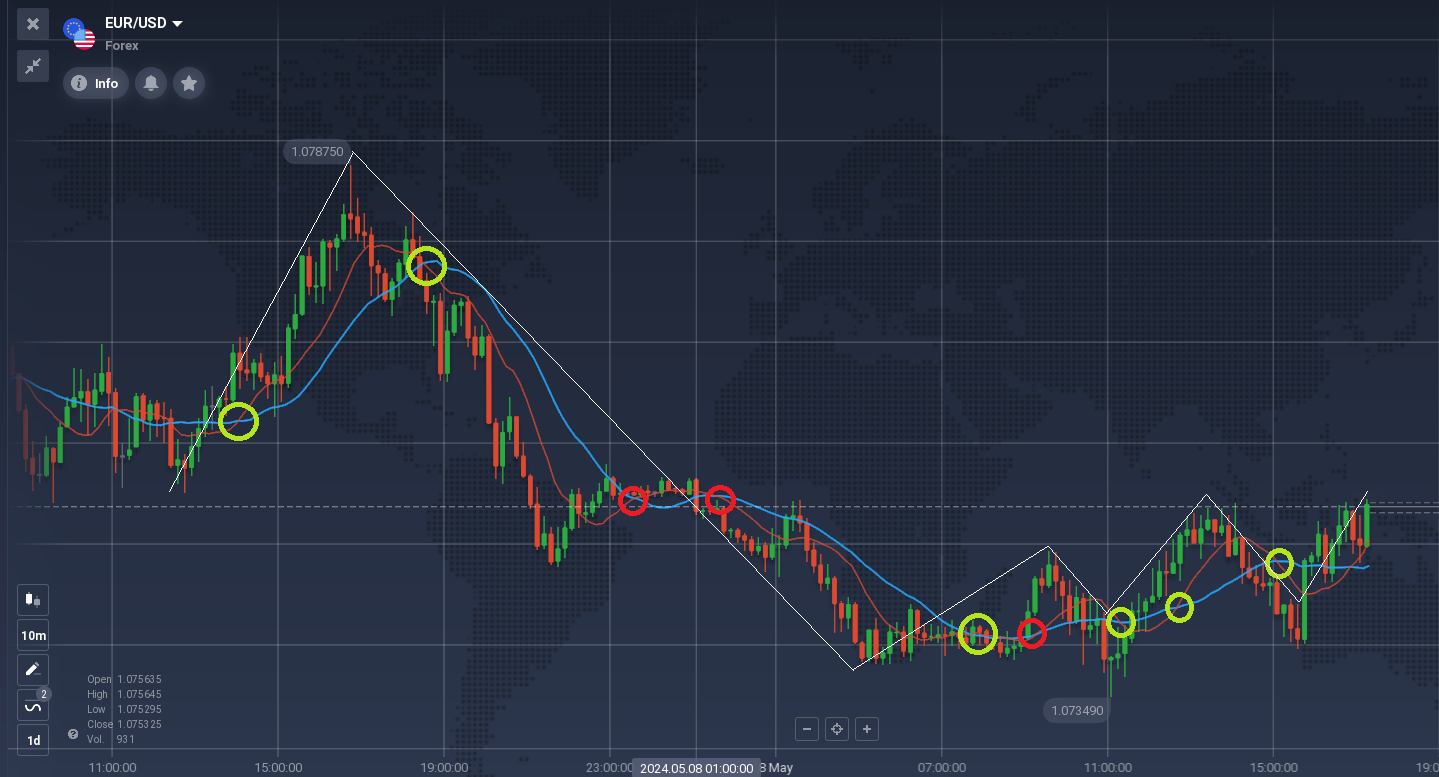
Over one day, the trend reversed 7 times. The Double MA successfully spotted 6 of the upcoming reversals (marked green). But 3 times it provided misleading information (marked red). In these cases, the lines crossed but no reversal occurred; this was due to weak retracements within a larger trend and overall market indecision.
Not bad, but it could be better. For this reason, many traders use indicator combinations and alternative tools to confirm the data received. Let’s see if incorporating candlestick pattern analysis could change the picture.
How to analyse Forex charts using candlestick patterns for confirmation
As you can see from the example above, the indicator analysis performed well during large trends and struggled when the market was indecisive. Would candlestick analysis have helped us notice that?
Let’s take a closer look at the problematic zone where we observed one of the false crossovers:
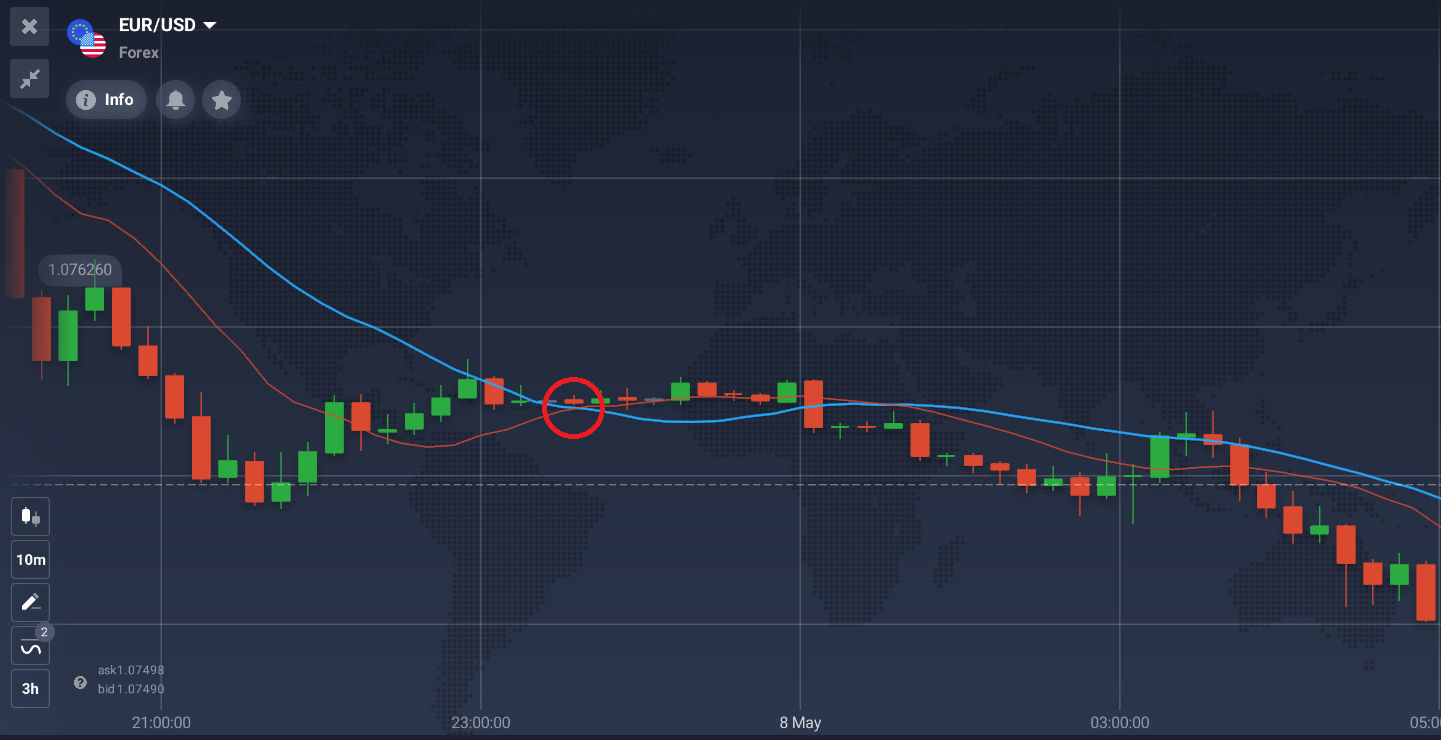
This spot was preceded by a massive downtrend, and the crossover was expected to predict a bullish reversal. However, as we observed, that didn’t happen — the price continued to decline.
However, if we take a closer look at the candlesticks in that area, we’d notice a series of Dojis. They are tiny candlesticks with very small or non-existent bodies, indicating market indecision.
While Doji candlesticks often hint at potential trend reversals, this conclusion cannot be made without a confirmation candle following them. In our case, the next significant candle is still red, indicating the continuation of the bearish trend.
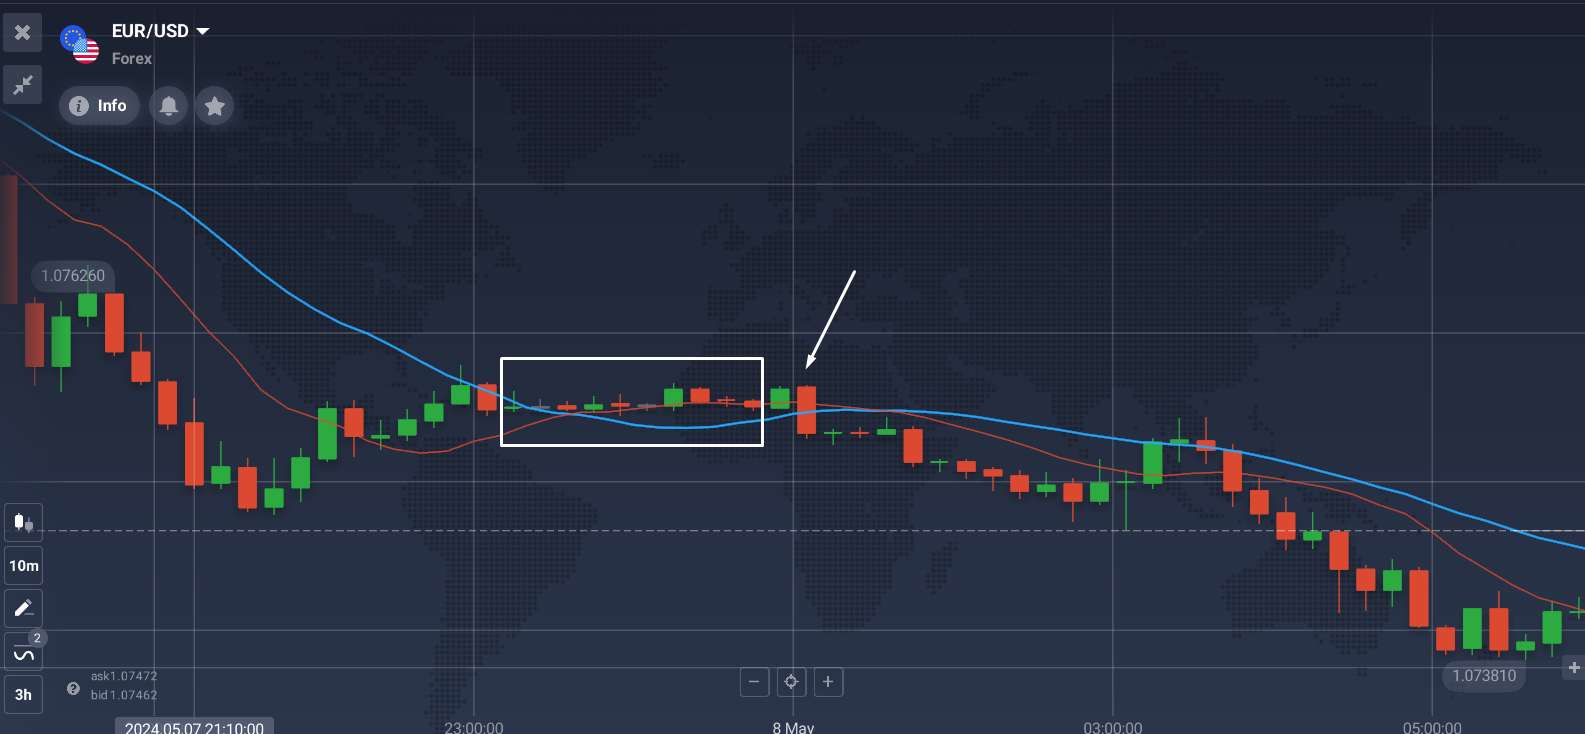
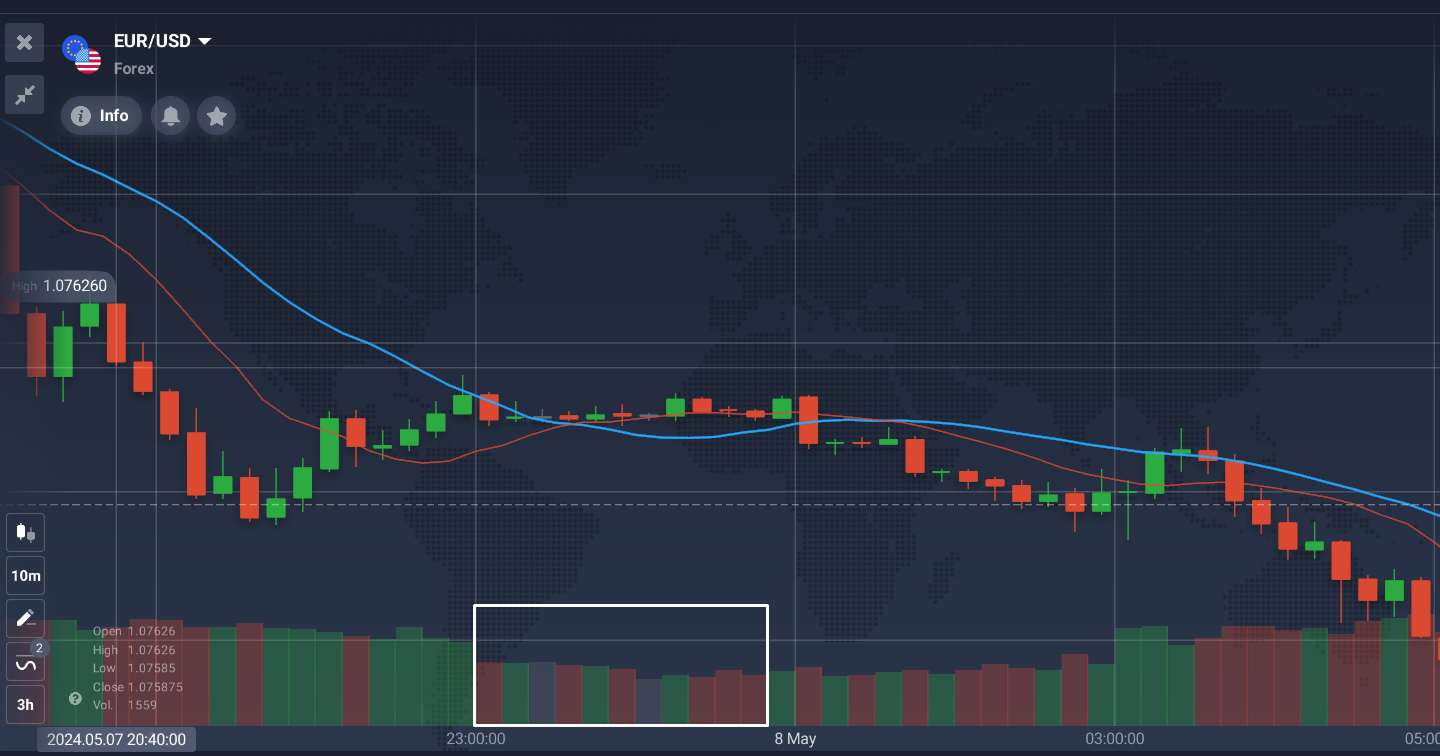
Indecisive spots on the chart are never a good place to make trading decisions. Normally, traders would wait for stronger confirmations from their technical tools before acting. This is supported by the Trade Volume widget at that spot, which shows very low volume, indicating that other traders are not rushing to open ‘Buy’ positions.
Obviously, other people’s actions shouldn’t dictate your own choices. However, in situations like this, it could serve as an additional indication of market uncertainty, suggesting that you should ignore your main indicator’s data.
Conclusion
Forex technical analysis doesn’t work 100% of the time and will occasionally fail due to factors like market volatility and economic changes. However, by using the right combination of Forex technical analysis tools like indicators, candlestick patterns, lines, and widgets, you may improve your ability to make informed trading decisions. These tools, when used together, may contribute to enhancing your approach and help you better understand market dynamics, leading to potentially more precise market entries and exits.
Note: The Company offers CFDs.
