Recent volatility in global equities markets has taken its toll on my accounts recently and I am sure there are others who fell the same. Just when a signal seems to develop new headlines hit the market and prices reverse. I am not just talking about equities but commodities, forex and cryptocurrencies; to look at the charts is to see the world financial markets selling off. My point? The problem with my trading of late is not the signals but the time frame I’m using. When times changes so must the time frames.
The age-old question, what time frame should I use, is irrelevant. Sure, you can pick one-time frame and only trade that way, but I will tell you, you won’t be profitable long term. First, what I mean by time frame is the length of time your chart represents. In most cases traders refer to time frame relative to the length of each candle or the amount of data in each data point, for example weekly, daily or hourly.
Multiple time frame analysis is a fantastic method of analyzing charts and at the heart of what I am about to reveal. In most cases multiple time frame analysis, MTF, is a top down approach to trading near term positions. What I mean is a long-term chart like weekly or daily sets trend and then the shorter time frame like hourly or five minutes is where you take signals. What this approach doesn’t do is tell you what time you should be using.
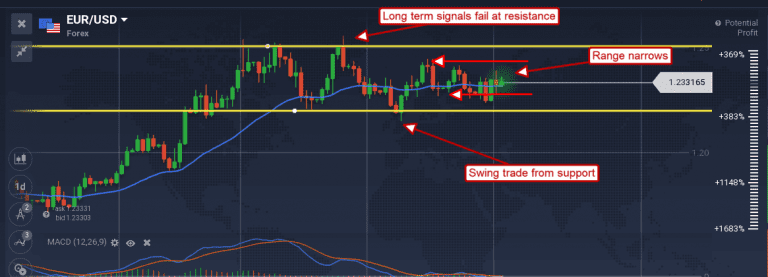
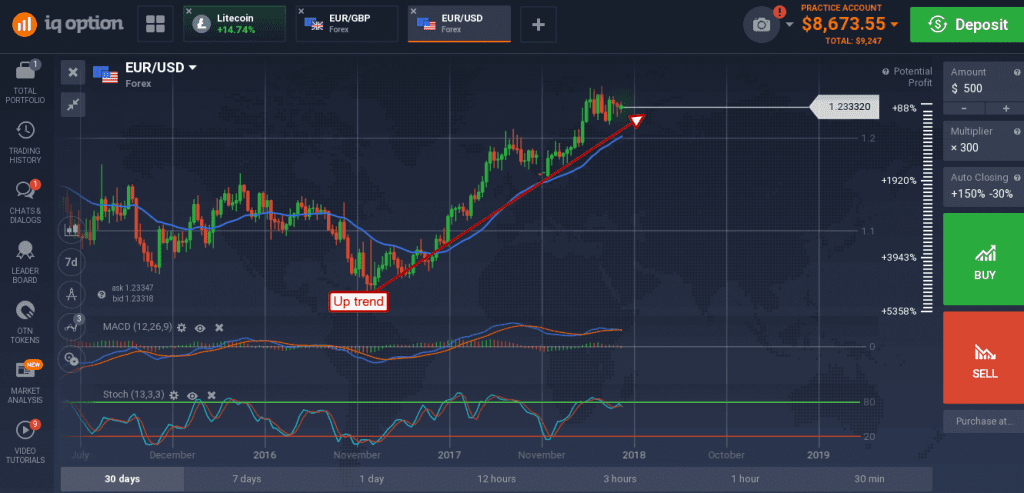
My approach is simple. I use the weekly charts to set trend and the daily charts as a base line for what to do in terms of my trades. When the market is trending on the daily chart it is better to use a longer-term time frame because price movements will be longer term. For example, if you look at the chart below, a chart of the EUR/USD weekly candlesticks, the pair is in an uptrend so the best trades on the daily chart would be bullish signals.
Now, looking at the daily chart it is clear to see that prices have been trending sideways within a range and that range has been narrowing. Bullish signals are developing within this range but without nerves of steel and ample account funding longer term trades are risky; the market is winding up on conflicting expectations and has volatility on the rise. This might mean no trading until clearer signals emerge, but it also may be a signal to adjust strategy by adjusting time frame.
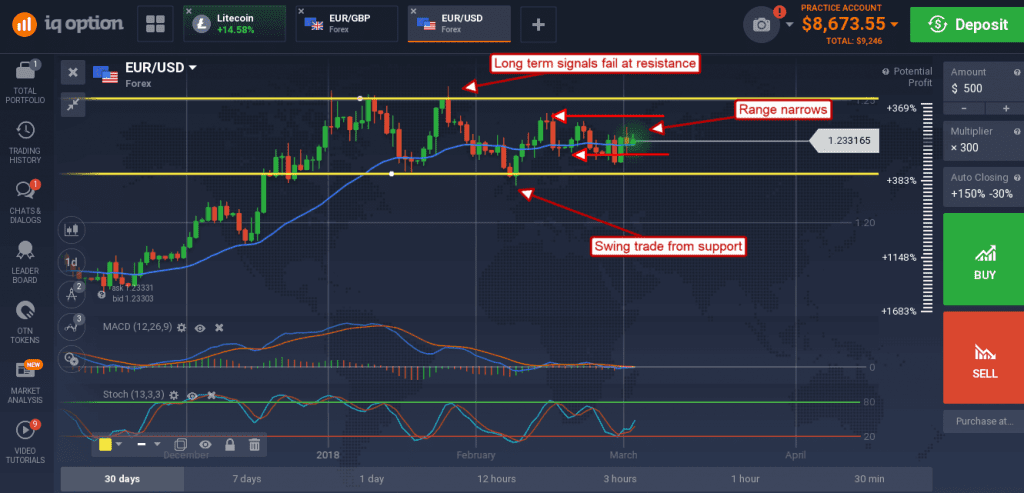
In this case the daily chart is not in alignment with the weekly chart which means no signals on this time frame. The thing to do now is use the daily chart as the trendsetter for a lower time frame. I prefer to use the hourly charts as my first stop on the way down, this time frame is great for swing trading within longer term trading ranges. Looking at the next chart, you can how support and resistance targets provide numerous signals for continuations and reversals within the range.
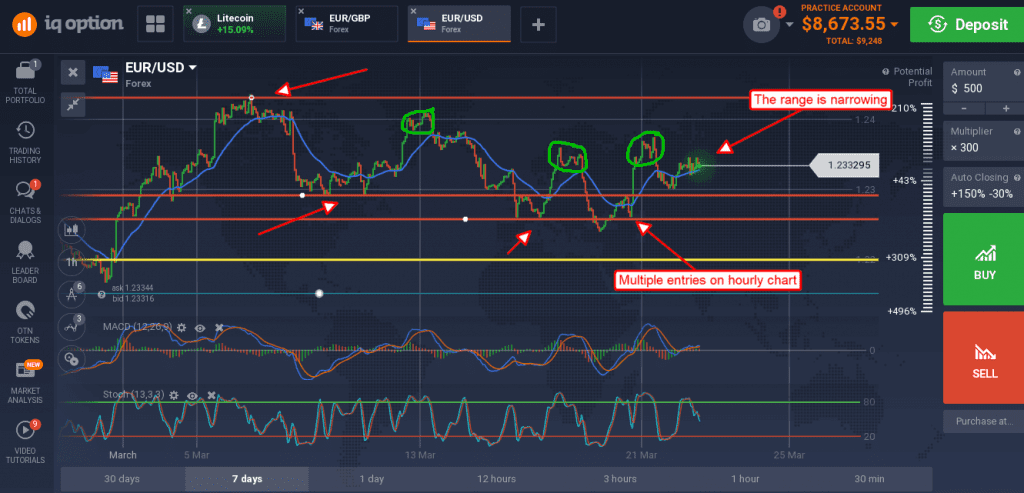
These signals are highly effective until the most recent week where the range narrows even further. This is when it’s time to move to a lower time frame, a time frame where those price swings are easier to see.
For me this means the five-minute charts. At this time frame day to day swings in the market are easier to see. Once again prices are bouncing between support and resistance targets drawn on the higher time frame chart.
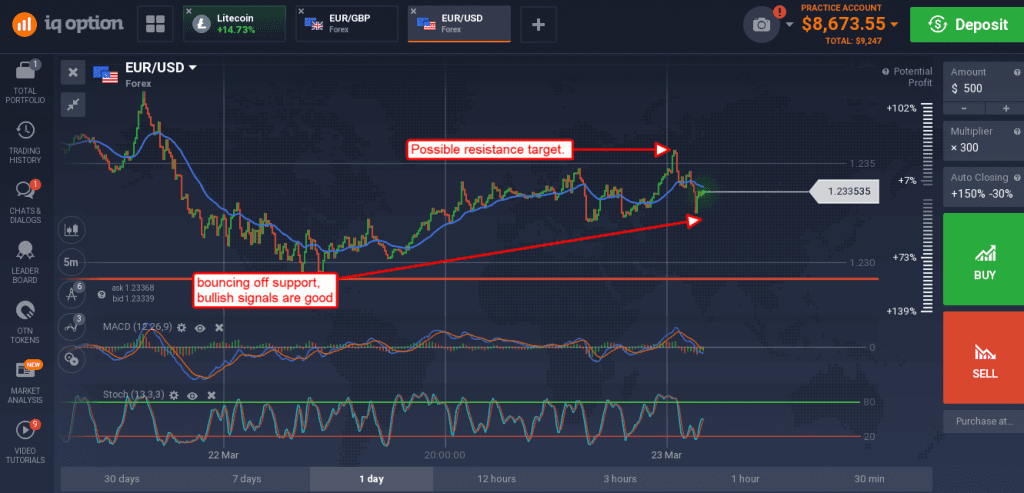
The key is to keep an eye on those longer-term time frames and not lose track of the bigger picture. If prices break beyond one of your five minutes or one hour support/resistance targets a better, longer term, signal may be developing.
