
In a dominant bear market, the cryptocurrencies could not find enough boost to keep up with an upward rally. However, recently, the coins have added quite a bit to their value, which resulted in the rise of the total market cap by around $11 billion in 24 hours – the market currently holds $271 billion.
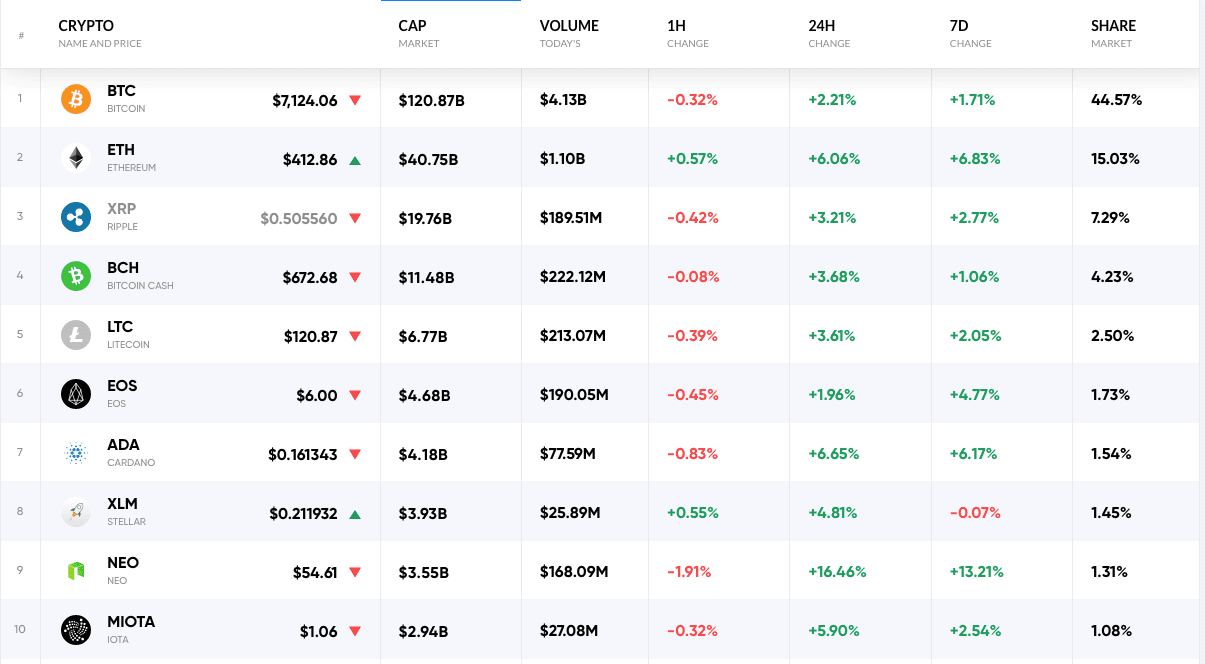
Cryptocurrency market data by coinrate.com
Ethereum
Ethereum unlocked the true potential of the blockchain technology in 2014, and for that, it received a lot of support from a huge community. However, in the current market, the coin is constantly shedding its value. The past week was rough for the coin, but it managed to recover some of its losses by the end of the week. Week-on-week, ETH appreciated by around 7 percent, which was fueled by the daily gain of 9 percent in last 24 hours. With $40.7 billion in market cap, ETH holds 15 percent of the entire crypto market and is dominating as the second largest digital currency.

Considering the weekly chart, ETH had a few significant ups and downs. With the continuation of the downward rally, the coin touched $360 as its floor value following a surge in the price from $380 to $417. The coin also faced stiff resistance at $384 in the mid-week sessions. Though the resistance successfully pushed it downward for a while, ETH, with a bullish trend breached this barrier. It is currently maintaining a positive trend and has reached above $410, where it is facing some momentary resistances.

Because of the bullish trend, the technical indicators are soaring on the charts. Both the oscillators – Stoch and RSI – are running above the overbuying margin. Indicators like MACD and ADX are also signaling a bull due to the price surge. However, the long dominated bear has kept 200 SMA above 100 SMA.
DASH
Designed to maintain the privacy of the users, DASH has gathered quite a praise on the market. During the heights of the market, DASH had gained tremendously, however, due to its obedience to the market trends, it shed a lot as the bear made its grip. However, as the market is trying to gain its lost value, DASH has added 6.5 percent to its value in the past 24 hours, which added to the weekly appreciation of 7 percent. With $2.5 billion in market cap, DASH is the 12th largest coin on the market, but it is not witnessing a massive volume in trading as in the past 24 hours only $65 million in trading volume was recorded – a number less than some of the coins with less market cap.

After a massive downturn, DASH initiated the week with an appreciation from $284 to $341. However, the positive movement did not last for long as the coin tanked below $290. As the resistance at $303 acted in the coin, it further went down to touch $283. With a sudden rage among the traders, the coin bounced from the abyss and zoomed past the barrier created by the resistance. The coin is maintaining an upward rally and is currently trading around $318.
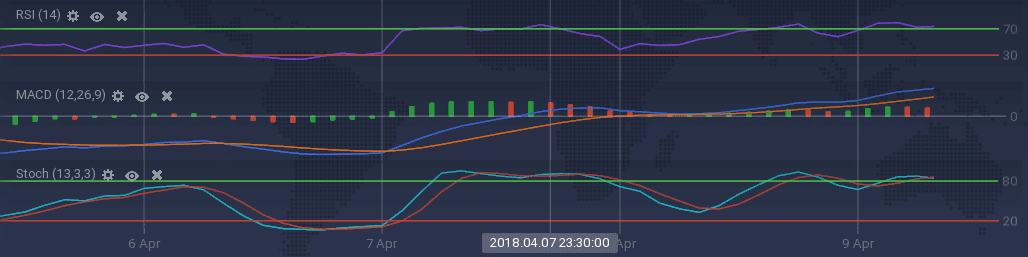
All the technical indicators are telling the same narrative about the price curve movement. Stoch and RSI both are hovering in the overbuying zone with strong strong bullish signals from MACD. ADX is also signaling a bullish dominance.
Conclusion
After the dominance of the bear for a while, the market turned stagnant. However, the coins are tiring hard to maintain a bull for a while to regain their values. Though in the recent hours, the market has added significantly, we can’t say if it will last for a while, as we have seen such momentary bulls in the past.
