
From massive bull in early 2018 to the dominant bear since February, the cryptocurrency market has been really dramatic this year. Now, the drama continues with a highly fluctuating market. The total market cap has hit $259 billion after shedding 12 billion in last 24 hours.

Cryptocurrency market data by CoinRate.Com
Bitcoin
Bitcoin had a wild ride this week. For it, the primary concern has become to stay above $7,000 rather than adding some of the lost values. In last 24 hours, the coin depreciated by 5 percent, which added to the weekly loss of 7 percent. With $115 million in market cap, BTC is holding 44 percent of the market. However, due to falling prices, the trading volume in last 24 hours was mere 4.7 billion.
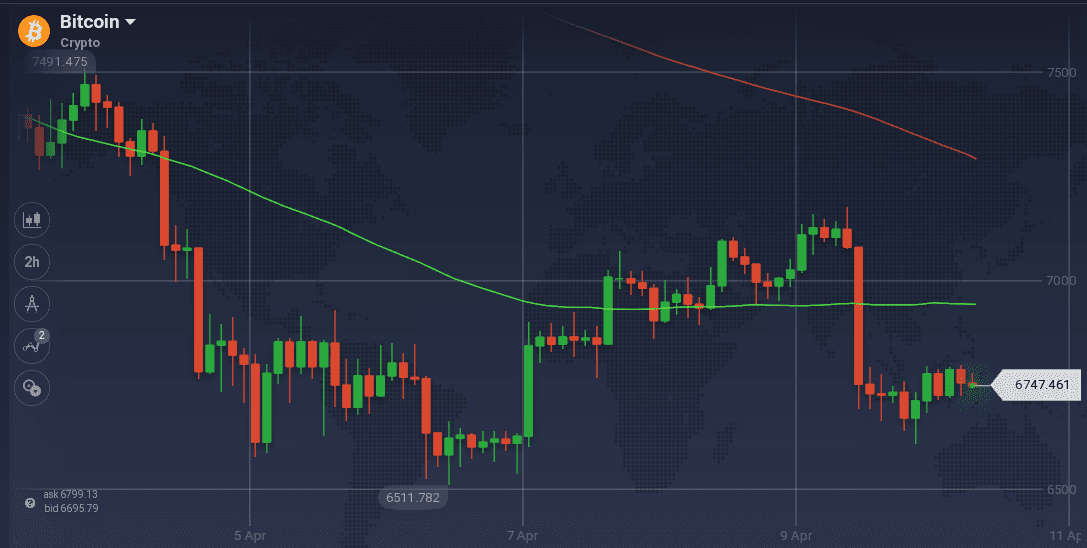
After a bullish run, BTC touched $7,500 from as low as $6,400. However, the peak resistance and dominant bear could not let the coin to maintain the peak. This quickly resulted in a pullback and BTC fell drastically to go below $6,600. Though the coin tried to move up, resistance at $6,860 did not allow any further recovery and even pushed the coin down to $6,500. From that pit, BTC gained some upward momentum to climb with a bullish trend. After reaching above $7,100, the coin took a massive hit as it went down below $6,700 within hours.
Currently, with support around $6,670, the coin is trying to recover, however, traces of resistance are also there at $6,800.
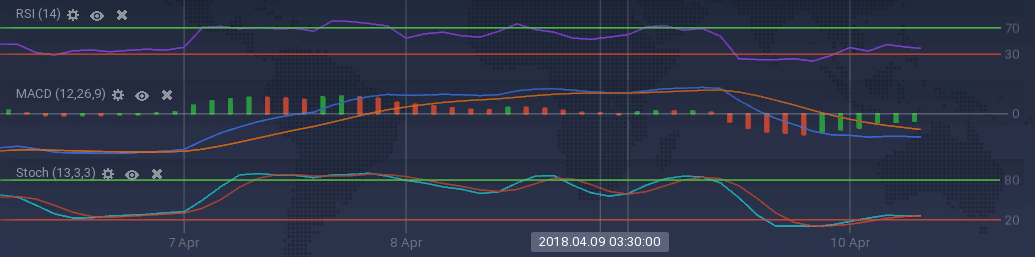
The sudden drop of BTC has forced the bullish indicators to go bearish. The oscillators – Stoch and RSI – which are running along the overbuying border, are now fluctuating up and down of the overselling line. MACD also went from bells to bear, however, some signs of recovery can be seen.
Bitcoin Cash
Bitcoin’s arch-rival Bitcoin Cash is suffering the same fate as BTC. The coin depreciated 6.4 percent on the weekly chart and 5 percent on the daily. Tough the coin still holds $10.9 billion in market cap, the daily volume of the coin took a massive hit due to the declining prices. It was recorded to be $236 million in last 24 hours.
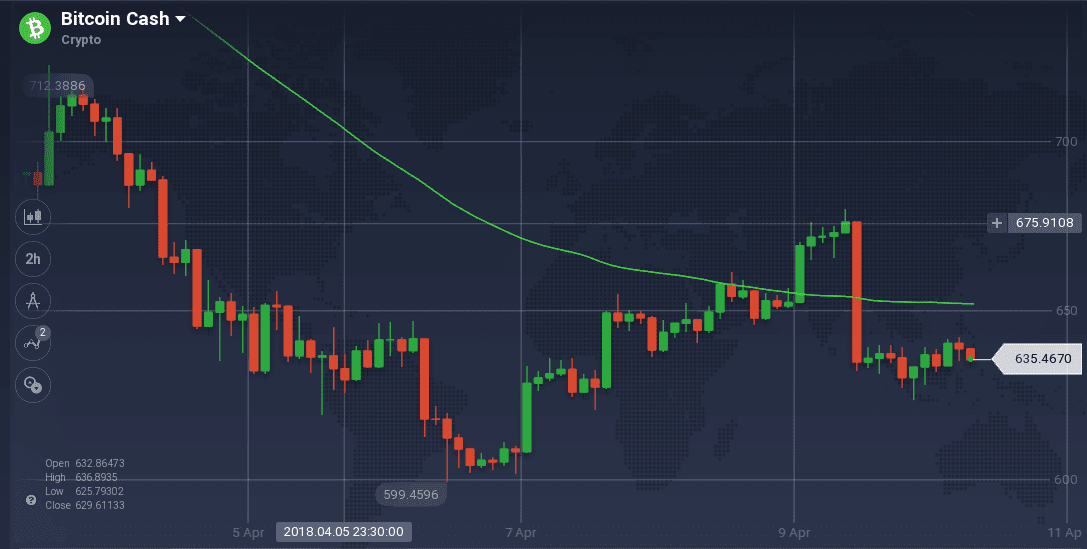
On the weekly chart, BCH climbed above $710 with a bullish run. However, a bearish sprint followed, which took its price to as low as $600. Along the way, $629 tried to act as a support level, but resistance at $645 did not allow any recovery and further pushed the price down. However, the coin pivoted after reaching the floor price as a bullish run with a strong trend took the price to $680. Similar to BTC, BCH also suffered a massive drop from that peak and is currently struggling to find a support level.
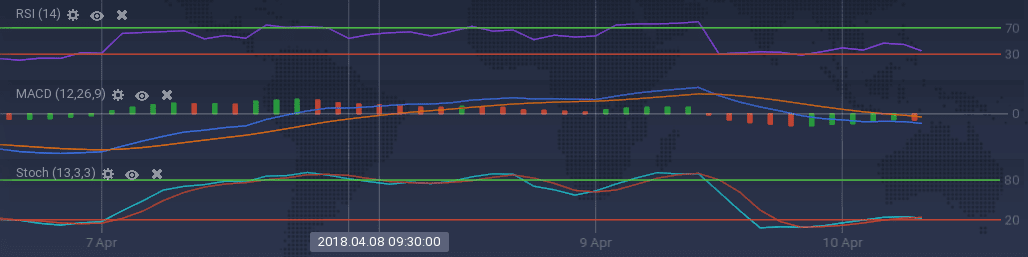
The indicators are following the price curve of the coin and thus are signaling bear. Stoch is running along the overselling mark and so is RSI with a downward inclination. Currently, RSI is at 36 percent. MACD and ADX are also showing bearish signs.
Conclusion
The cryptocurrency market is very vulnerable right now. With all the FUDs going on, the prices took a massive hit. However, it is to be seen, how long the market will take to attain a positive track again.
