
The cryptocurrency market added a significant amount after a few weeks of bear and fluctuation. The market added nearly $35 billion in last 24 hours and thus the total market cap went up to $311 billion. Coinrate.com now has more than 1600 coins listed and most of them are showing positive movement in recent hours.
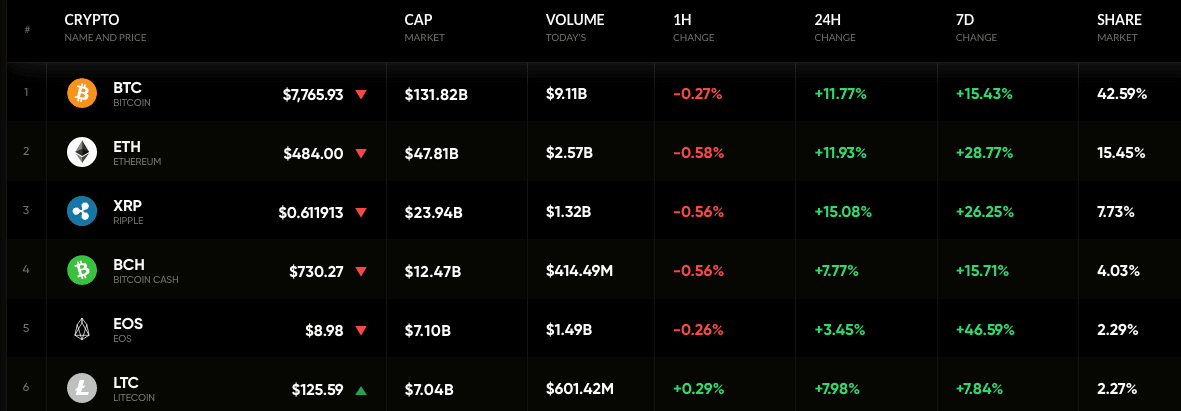
Cryptocurrency market data by coinrate.com
Bitcoin
Bitcoin had a massive gain after weeks of depression. The coin jumped around 12 percent in last 24 hours, which resulted in a 15.5 percent week-on-week appreciation. The market leader now holds $131 billion in market cap and thus captured more than 42 percent of the entire market. The rising prices also boost the trades, and in last 24 hours, the trading volume was recorded to be $9.1 billion.
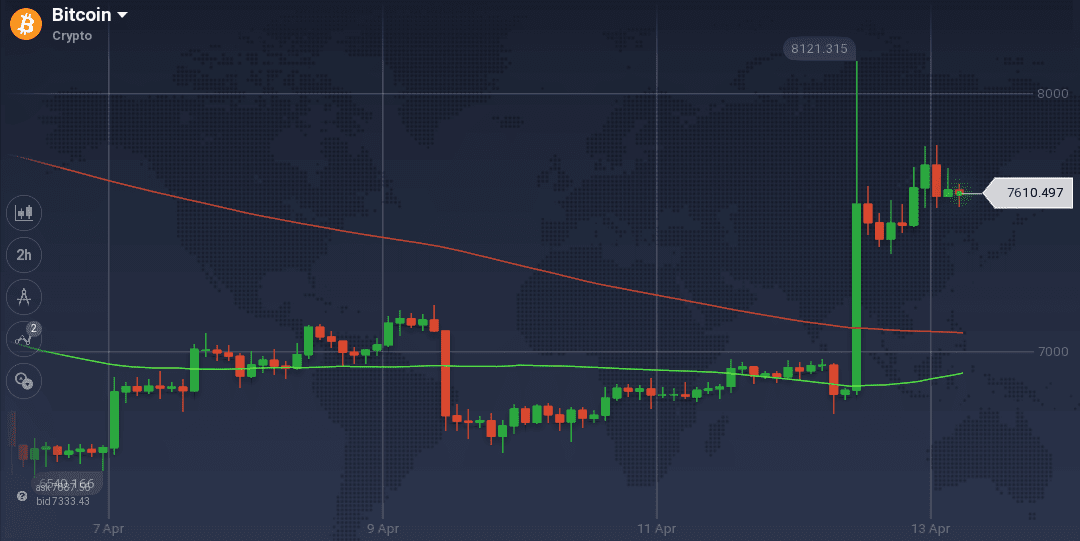
The sudden boost in the prices of Bitcoin happened in last 24 hours. The coin breached the resistance at $7,000, which it was facing for a while and even went above $8,000 for a brief period. On the daily chart, BTC prices leaped from $6,850 to $8,130 in mere hours – an appreciation of 18.6 percent. Though the coin could not maintain its value above $8,000, it is now running strong above $7,600. The upward momentum was boosted by the support at $7,430, however, BTC is also facing resistance at $7,800.
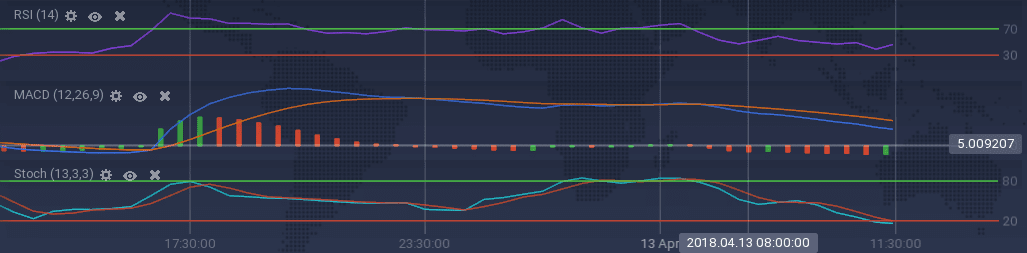
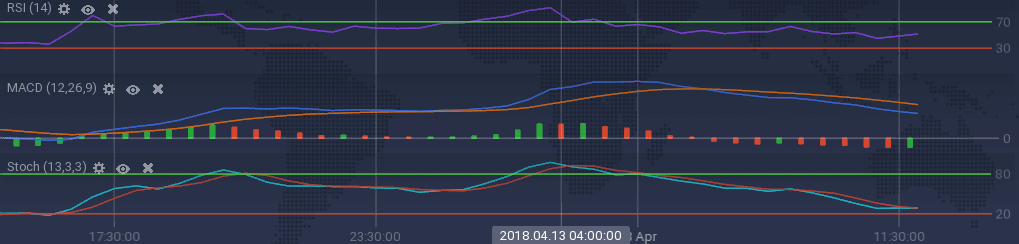
The soaring price of BTC resulted in a bullish run of the technical indicators. However, due to the resistance faced by the coin in recent hours, many indicators have taken a downturn. A massive trend reversal can be seen in case of Stoch as it went down from overbuying zone to overselling area. MACD curves are also signaling bear. On the contrary to these indicators, RSI has an upward inclination, which is currently at 48 percent.
Ripple
XRP, the token issued by the San Francisco-based blockchain startup Ripple, has created a stir in the market earlier this year by gaining tremendously. However, the demand and charm of the coin wore off slowly as the bear clutched the market and started to dominate. However, with the latest bull in the market, the coin bounced up and has added more than 15 percent to its value. This also resulted in a weekly appreciation of above 26 percent. The coin is seeing a trading volume of $1.3 billion and as always, the South Korean market is dominating XRP market with more than 46 percent of the trades. JPY also have a significant trading volume against XRP trading with 7.8 percent.
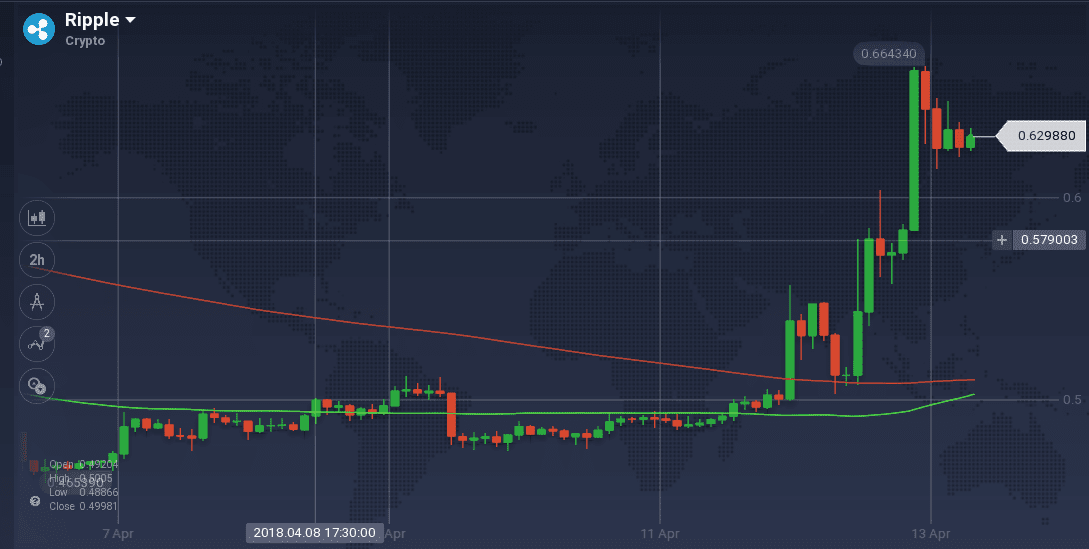
On the weekly chart, XRP mostly faced multiple levels of resistance between $0.49 and $0.50. Though it had initial support at $0.48, the coin eventually went down to $0.47. After a gradual to $0.50, the price of the coin shot up at once. Within the next 24 hours, XRP touched $0.66. It, however, is facing some resistance near the peak and its trading around $0.629. Moreover, the coin had a support around $0.62.
Due to the presence of both resistance and support and impact of both on the price of XRP, the technical indicators are throwing mixed signals. MACD and ADX are indicating a bearish move, while RSI has an upward inclination in its movement. Stoch is also showing signs of a reversal after dropping for a while.
Conclusion
The long waited bull finally hit the cryptocurrency market after weeks. Though the demand for the coins soared over the last 24 hours, it is slowly wearing off, as traders are finding a way to exit with their short-term profits. However, we can also expect more waves of bull as many optimistic investors are jumping in.
