
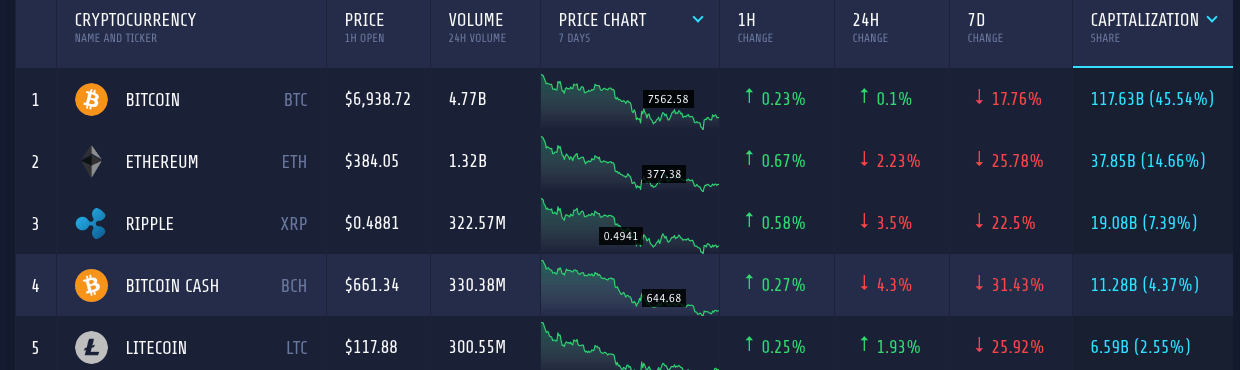
The cryptocurrency market is in a freefall from a while and the depression throttled over the weekend. For the first time since late November last year, the total market cap dropped below $250 billion to reach $243 billion. However, since then, the coins are trying to gain bits and pieces and this lifted the market cap to around $258 billion.
Bitcoin
The dominance of Bitcoin is uncontested in the market. Now with the accelerating bear all around, the coin captured more than 45 percent of the market. However, bear has dominated the coin itself for a while. In the last 7 days it went down by around 18 percent and at some point, it dropped below $6,500. It now holds $117 billion in market cap, compared to the apex of $331 billion in last December. The depreciating value clearly hit the trading volume as in last 24 hours, it was mere $4.7 billion.
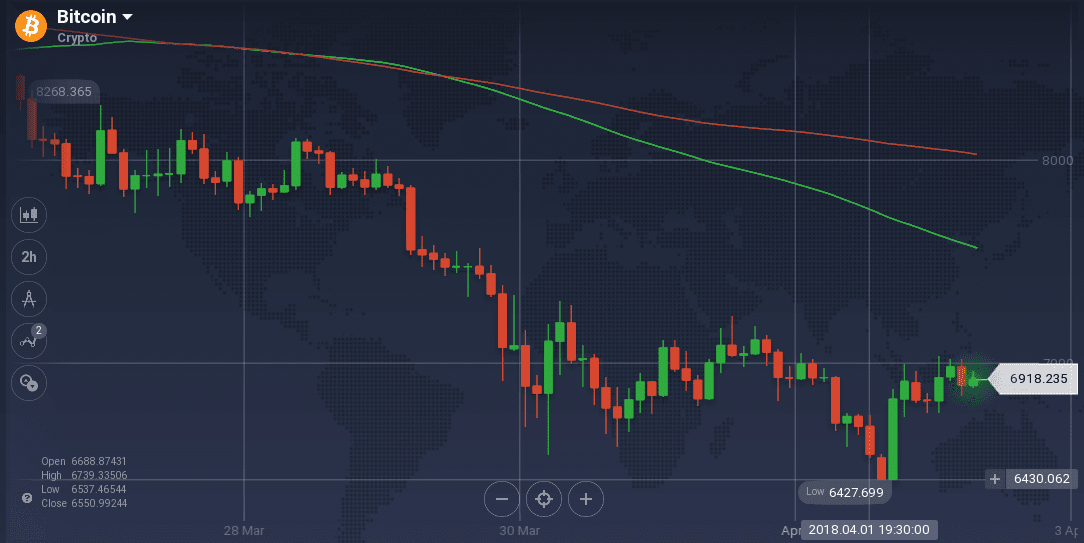
Bear and barriers dominated Bitcoin on the weekly chart. As the already falling coin received some support at $7,815, the formation of resistance at $8,100 sealed the chance of any recovery. But the support was not strong enough to hold the value for long and it slipped below $6,700 with a strong bear in just 24 hours. Though the coin tried to rebound from there, another newly formed resistance at $7,150 strongly held the coin from recovery. With this, the coin further slid to go below $6,450. However, the coin rebounded from there but facing resistance at $7,000 again.

Due to the recent resistance, the indicators have slowed down after a bullish run since the recovery of the coin from the abyss. Stoch is taking a downturn after running bullish along the overbuying zone, however, an upward inclination can be seen in case of RSI, which is currently running at 56 percent. MACD curves also went bullish before slowing down due to the resistance.
Ethereum
Ether is another big loser in the bear market – even bigger than Bitcoin. The coin went down by 26 percent on the weekly chart and is still incurring a loss of 2.2 percent on the daily. With $37.8 billion in market cap, ETH captures 14 percent of the market. The dipping prices also impacted the trading volume which was recorded to be $1.3 billion in last 24 hours.
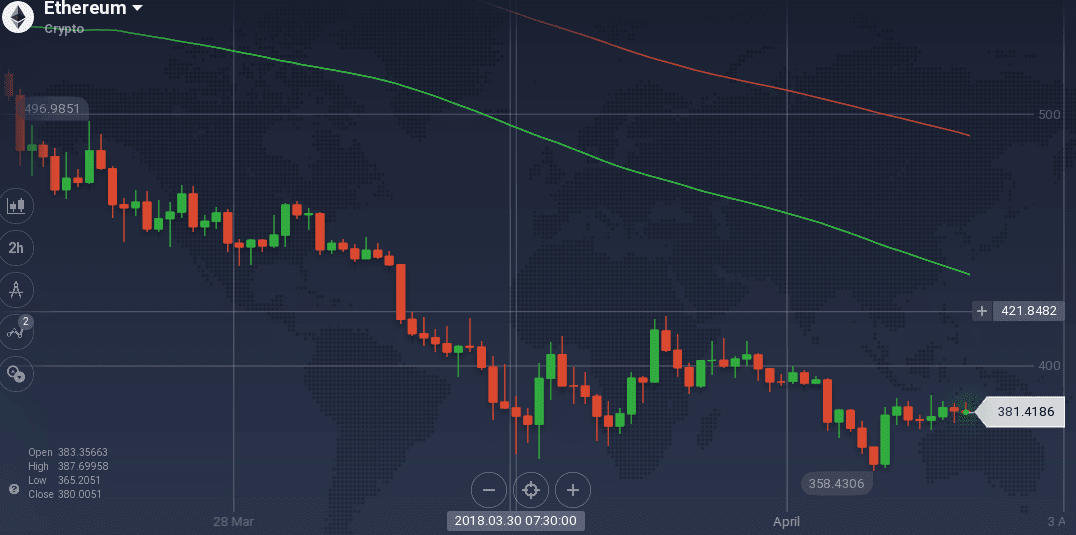
On the 7-day chart, ETH was dominated by bears – both gradual and steep. At the start of the week, the coin slid from $515 to $440 with a gradual bearish trend. It further dropped to as low as $363. On its way to recovery, ETH is facing massive resistance at $405. After slipping down again – this time below $360 – the coin rebounded, but is facing stiff resistance at $385. It is testing the level with support at $377.

The positive sign of recovery has made the indicators to go bullish, but the presence of resistance is pulling them back. Stoch is maintaining a gradual upward inclination, while RSI completely went flat at 51 percent. MACD is also hinting bull, but nothing is prominent.
Conclusion
The market has hit its lowest since the achievement of its peak earlier this year. The ongoing FUDs have fueled this downturn. However, it can be said that it has still tremendous potential to bounce back with force.
