Support and resistance levels are significant levels on the asset chart that the price has a chance of retracing from. Trading on breakouts and trend reversals is a popular method of choosing market entries.
Support and resistance lines are the most obvious technical analysis indicator. At the very least, you should give them a try because a lot of traders all over the world rely on them.
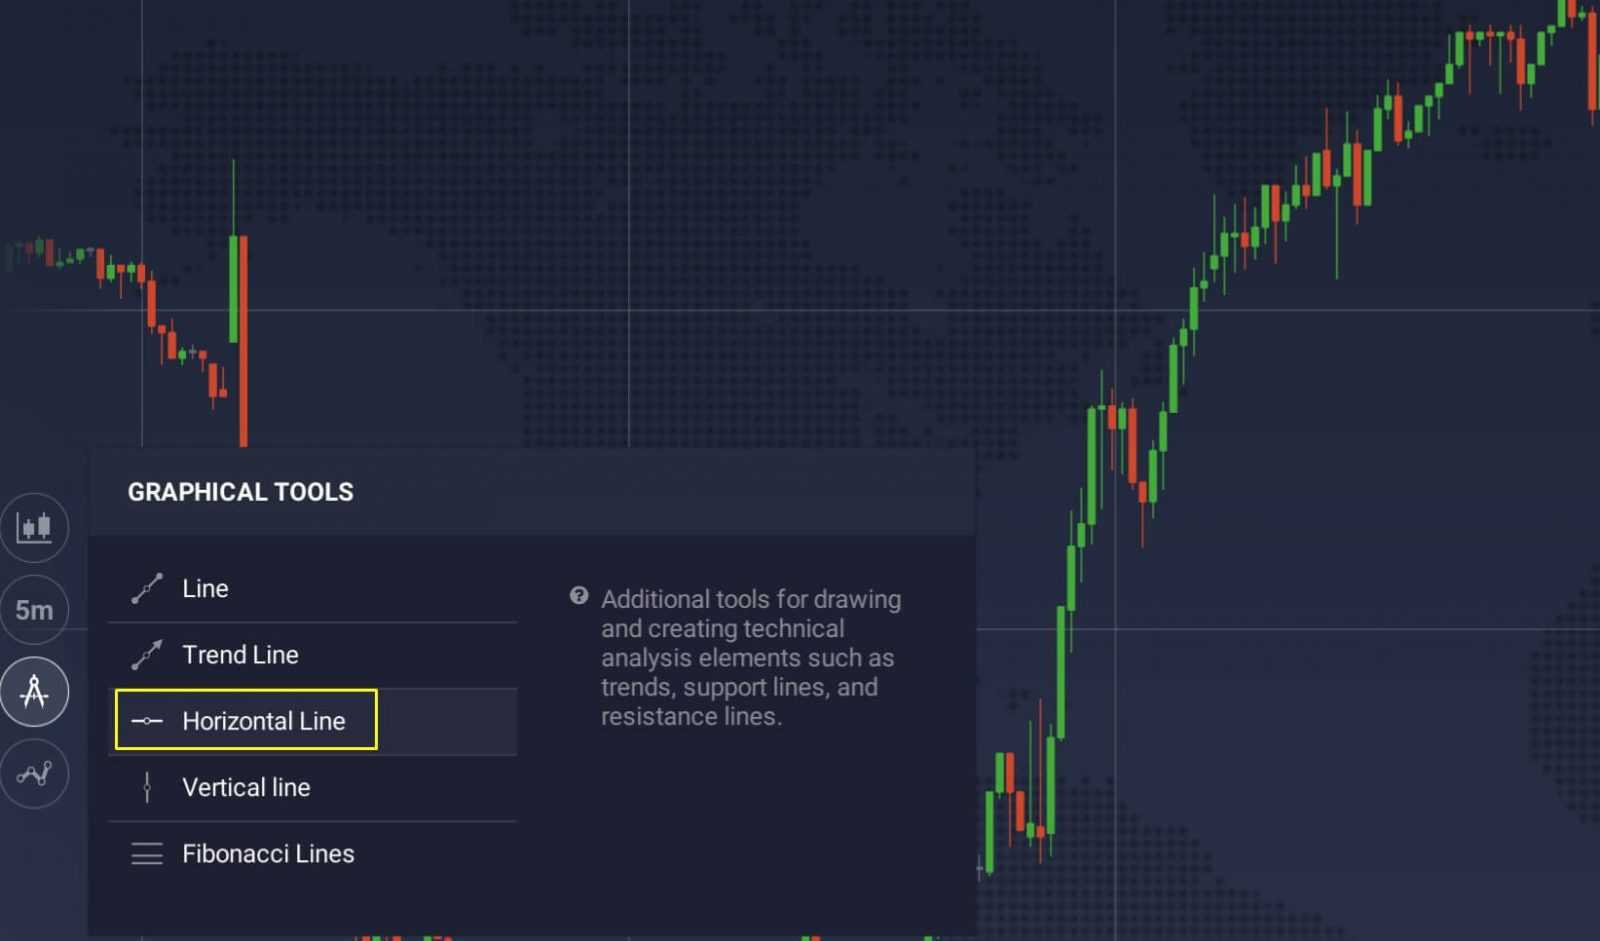
Support and resistance on the chart
You can draw these lines on any kind of chart: bar, candlestick, area, or line. But as with most other types of technical tools, they are most useful on the candlestick and bar charts. Support and resistance levels can help traders figure out at what point to purchase an asset with a falling price, and when to consider selling it.
Support and resistance levels reflect peaks and troughs on the price chart. These local price turning-points are the foundation of trading. They represent the law of supply and demand. Traders who rely on support and resistance levels utilize strategies for both rebounds and breakouts.
Rebounds
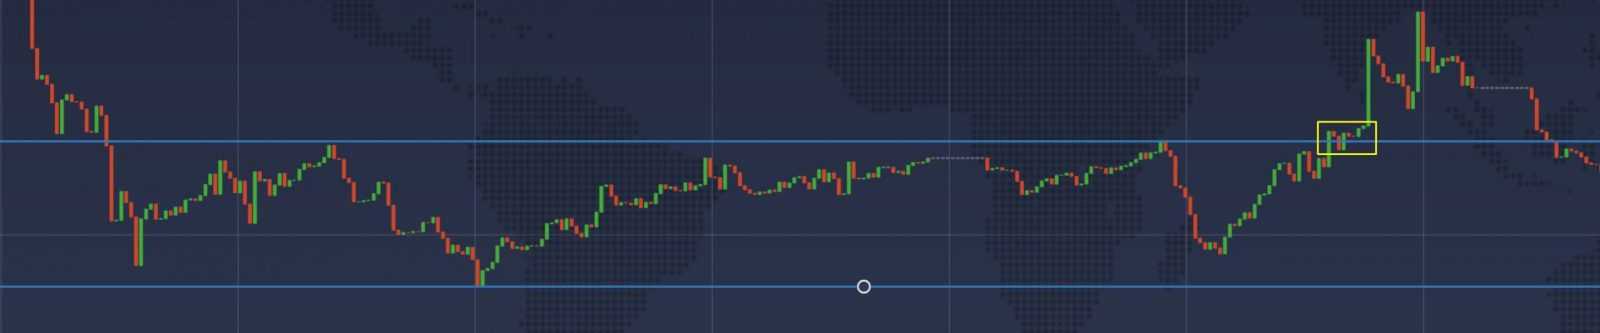
When the price approaches levels that it bounced back from in the past, it can rebound again, thus forming a price channel.
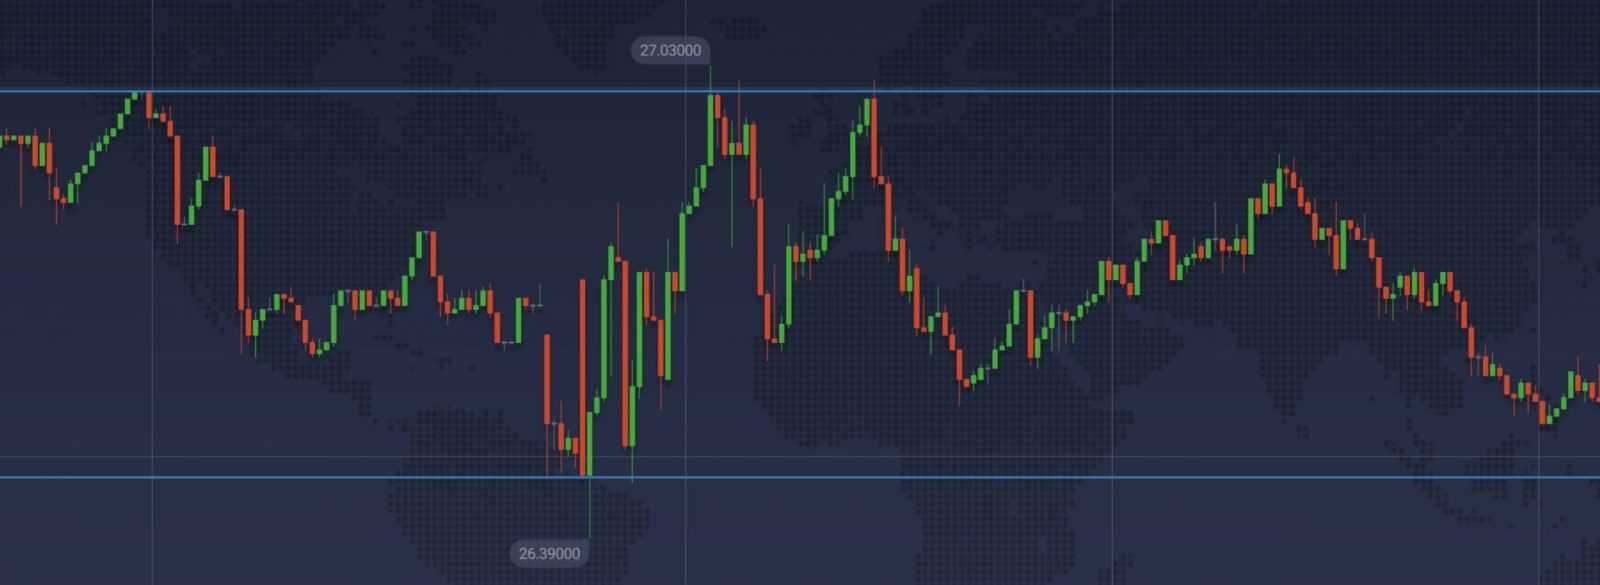
The picture above shows the price moving sideways with clear boundaries. The upper limit is the resistance, and the lower limit is the support. Some traders treat a rebound as an entry opportunity. They then close the deal when the price gets to the upper boundary. A short entry point can appear when the price rebounds from the resistance level.
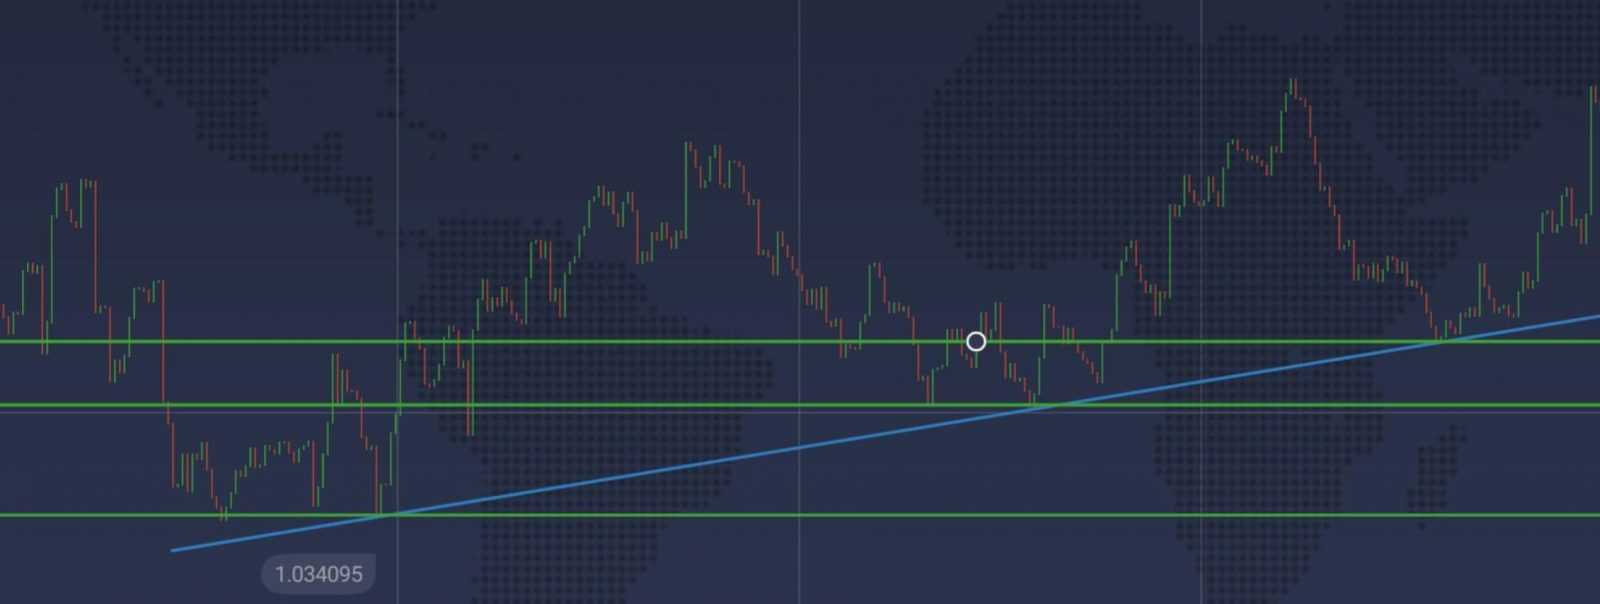
In addition to horizontal levels, there are also inclined levels. These are called trend lines.

Trend lines indicate the direction of price movement. They are built using the local maximums of the downtrend and minimums of the uptrend. Note that you can also add horizontal levels on the price chart as a part of the general strategy.
It is also possible for an old resistance level to turn into a new support line (when the asset price goes up), and vice versa for a downward price movement. Retracements in the direction of the trend can be treated as one of the signals. If the retracement is stronger and the price breaks through the trend support, traders consider applying a breakout strategy.
Breakouts
Support and resistance breakouts sometimes offer an opportunity to ride a strong trend. Note that this technique is harder to use than the previous one, because the trader needs to watch the market almost constantly so as not to miss an entry point. Many traders who take advantage of the breakout don’t enter immediately, but wait for the retracement after the breakout, and only then make their entry.
Fakeout
Breakouts can be real or fake. False breakouts can confuse traders. The latter believe that since the price broke through the level the asset should be trending, but that is not always the case. The price can also go back below the level and head in the opposite direction.
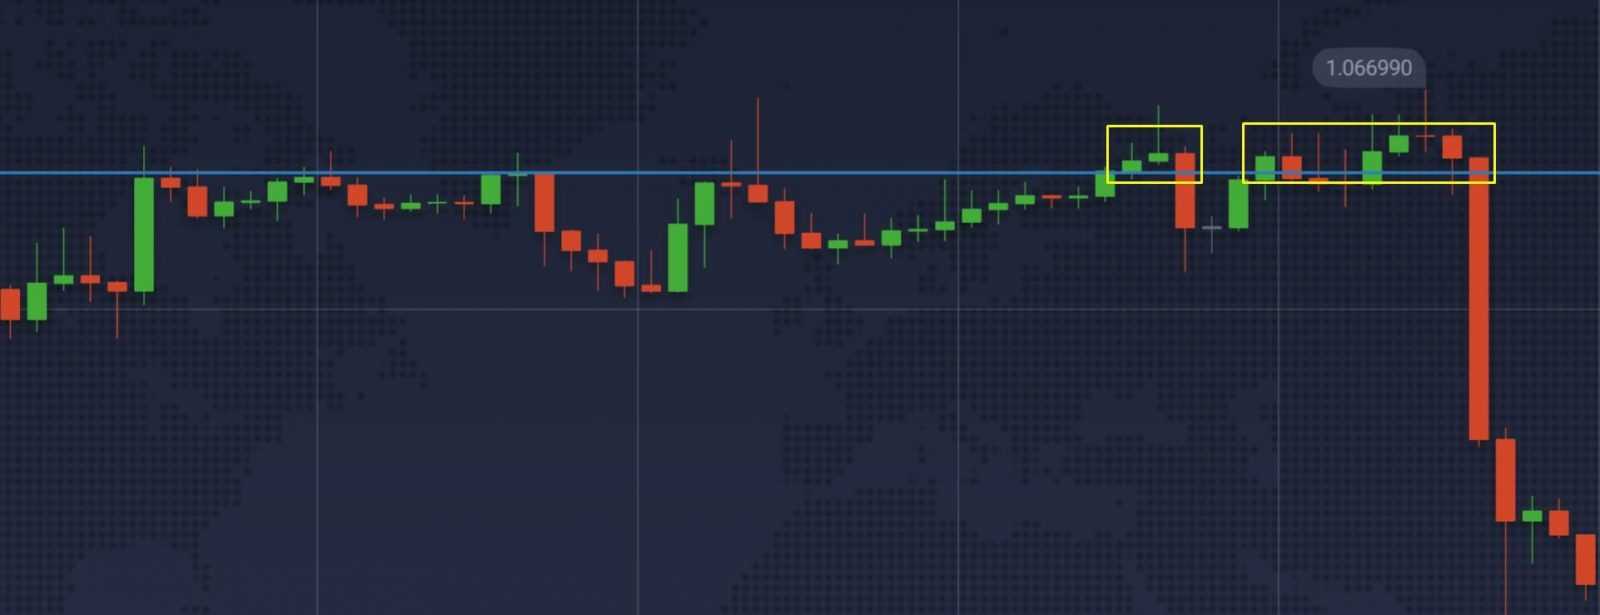
In such cases it can be helpful to wait for the next candle to close, which may or may not become a confirmation of the new trend direction. If the price comes back after the breakout and the candlestick closes in the opposite direction, then this is probably a fakeout.
In the event of a true breakout of the trend, some traders prefer to enter with the retracement after the breakout.
Conclusion
Trading on support and resistance levels takes advantage of the psychology of the masses — market participants focus on how the price behaved in a similar situation in the past. They measure the maximum and minimum prices over the current time interval (for example, over the past week), and evaluate events that took place during this time or that might occur in the near future. If the background information related to the asset doesn’t suggest any disturbances and there aren’t any events that would affect the asset more than in the past week, it is logical to assume that the price will remain in the same corridor going forward.
To trade using this method, you need to learn how to build support and resistance lines and monitor the background news to avoid running into an unexpected breakout. Also remember that no technical analysis instrument is 100% accurate, as all of them can provide false signals.
