With global indices in rally mode the Nikkei is fast approaching the 2 year high, will it break through?
Nikkei Poised To Set New Highs
With global indices in rally mode the Nikkei 225 is fast approaching a 2 year high and the possibility of setting a new high dating back more than 15 years. The question, will the Nikkei 225 break to new highs, is not quite the one traders should be asking. A better question is when will the Nikkei 225 break to new highs.
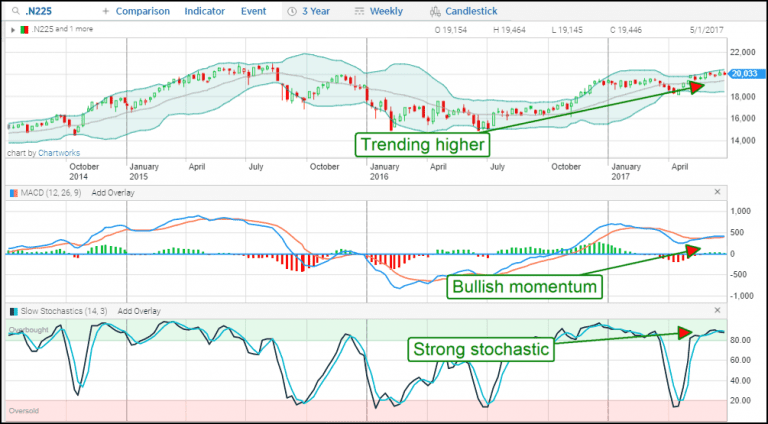
Based on the charts it really could be any day now. The long term weekly charts show an index in uptrend following a double bottom reversal. The reversal occurred in early 2016 along with the global market and has been drifting higher ever since. Momentum indications remain bullish although there is sign of consolidation ahead of the upcoming earnings cycle.

The global rally is driven on an easy monetary policy, improving economic conditions and corporate earnings growth. In Japan Abenomics and BOJ policy has been aimed at those very outcomes. It has, to some extent, accomplished them. While there is still room for improvement Japan is at least on the right track.
In the latest round of data 1st quarter GDP was revised lower to 0.3% from 0.5% on a quarter to quarter to quarter basis as private consumption growth drags on activity. Annualized growth came in at 1% revised down from 2.2% but despite the miss figures out of Japan are positive and indicate further expansion is on the way. According to the BOJ statement business spending continue to expand alongside “improvements in the employment and income situation” that are bolstering resilience in the consumer.
The shorter term daily charts concur with the long term assessment. There is some near term weakness in the market driven by tech sector profit taking and rotation ahead of the 2nd quarter earnings season. The index has pulled back from a 23 month high in tandem with the global sell off but there is no indication of reversal present. Price action remains contained with a tight near term range and above the key 20,000 level. The indicators are consistent with consolidation, both MACD and stochastic are trending near the middle portions of their ranges, and set up to fire trend following signals should the index bounce from this support level. A break below it is not expected but should it come the next target for support is 19,750.

The near term hourly charts concur with support at 20,000. The index has moved down to test the level and confirmed with a bounce higher. The indicators are both consistent with such a move and move higher. MACD and stochastic are both cresting bearish waves and rolling over in bullish and trend following signals, stochastic has already created a bullish crossover in confirmation. In the near term the upper target is at the current highs near 20,300. A break above there would be bullish, in line with outlook and trend following with a target at the current 2 year high near 21,000. A break above that would be bullish as well with targets setting new 15+ highs.

This article is based on market research

