Japanese GDP figures, released in the wee hours of Wednesday morning, came in much weaker than expected. Gross Domestic Product was expected to hold steady after rising a tenth in the previous month, but rising prices curbed growth. On a month to month basis GDP fell -0.2% showing a contraction in the economy that is both unexpected and accelerating from the previous month; Japanese GDP is now -0.6% below the levels it saw last year, contrary to the BOJs ongoing efforts to stimulate growth.
The reason is steadily rising prices. The Japanese Price Index, contained within the GDP report, shows prices jumped a half percent in the first quarter outpacing the 0.3% expected. While ordinarily a weak GDP report would send the yen lower the rise in prices points to BOJ tightening, which raises a conundrum for the central bank. They need to keep rates low to stimulate growth but with prices rising they may not be able to leave them low much longer.
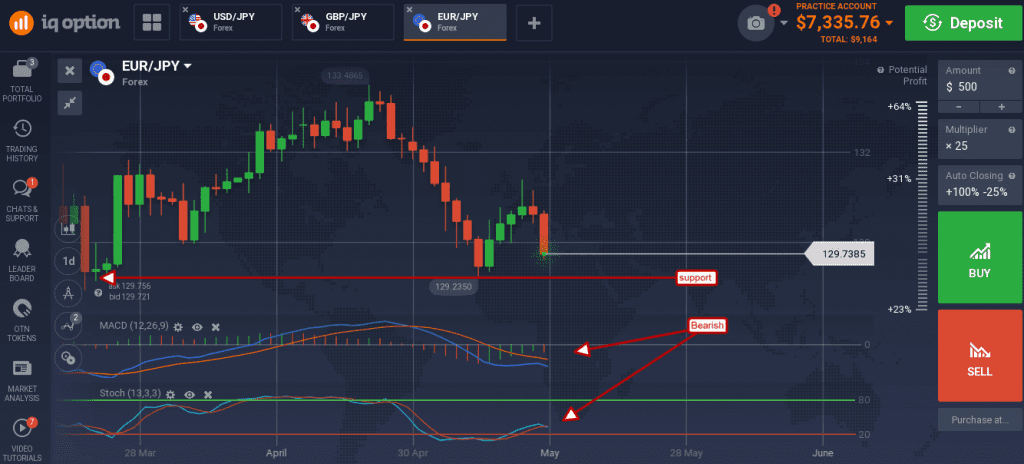
The yen advanced strongly versus the euro as tepid CPI data relieves the ECB of their need to sound hawkish. EU CPI grew as expected at 0.7% core for the year, well below the ECB’s 2% target rate. The EUR/JPY formed a large red candle moving down from the previous days candle. The move confirms resistance at the short term moving average with the caveat price action was halted near a key support level. The indicators have both rolled into bearish crossovers on the move that suggest a test of support is likely. Support is evident at the 129.50 level, a break below which would be bearish.

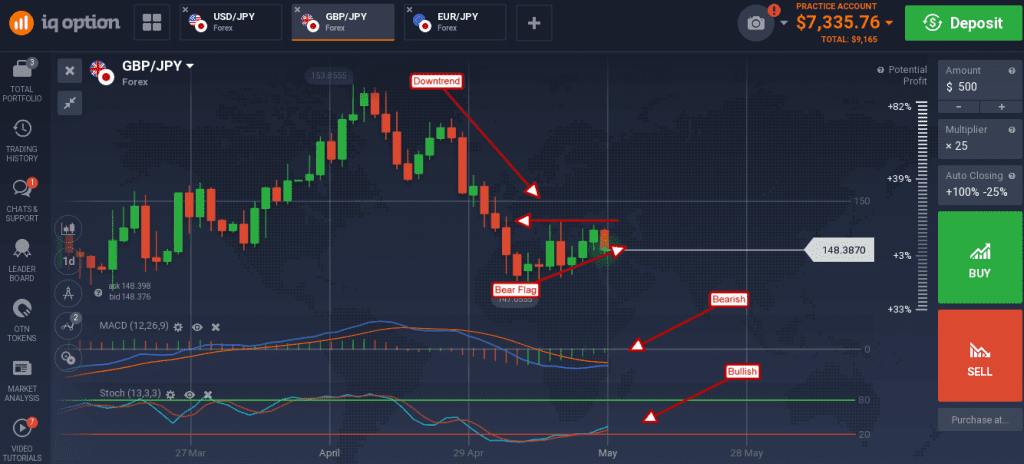
The yen likewise gained strength versus the British pound. Recent weakness in the UK data has taken impetus away from the BoE to raise rates and that has left the door open for the pound to move lower. Yesterday’s move confirms resistance below the short term moving average, a sign of weakness that is not echoed in the indicators. MACD momentum and stochastic are a bit mixed, momentum remains bullish, but the two are set up in a way suggesting a swing to the upside is still possible. If the pair moves lower a test of support near 147.00 is possible.

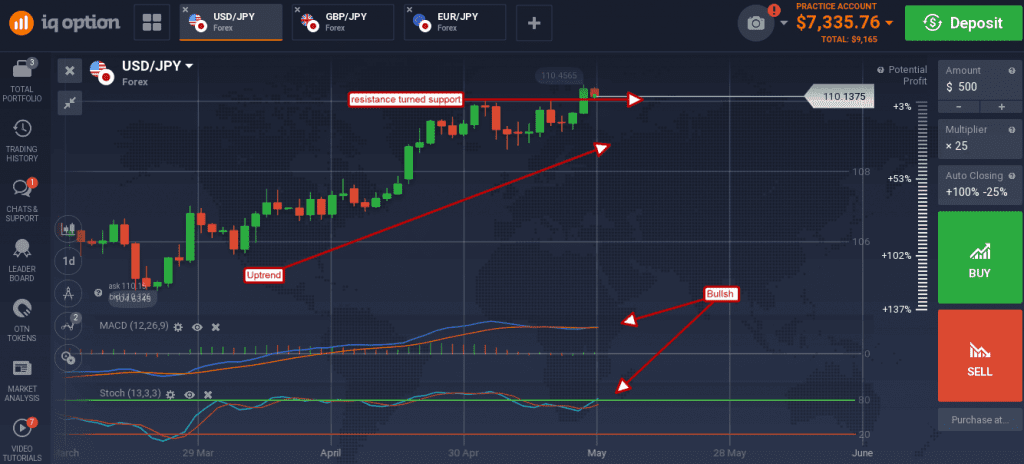
The yen strengthened against the US dollar, but the move was very weak and likely not to result in reversal. This pair is trending up on hot US data that shows economic activity and inflation are accelerating. Move on Wednesday was not supported by the indicators, both of which are showing bullish trend-following crossovers.

If the pair drifts lower support is probably at the 110.00 level and, if confirmed, would indicate resistance-turned-support and a continuation of the existing trend.

