


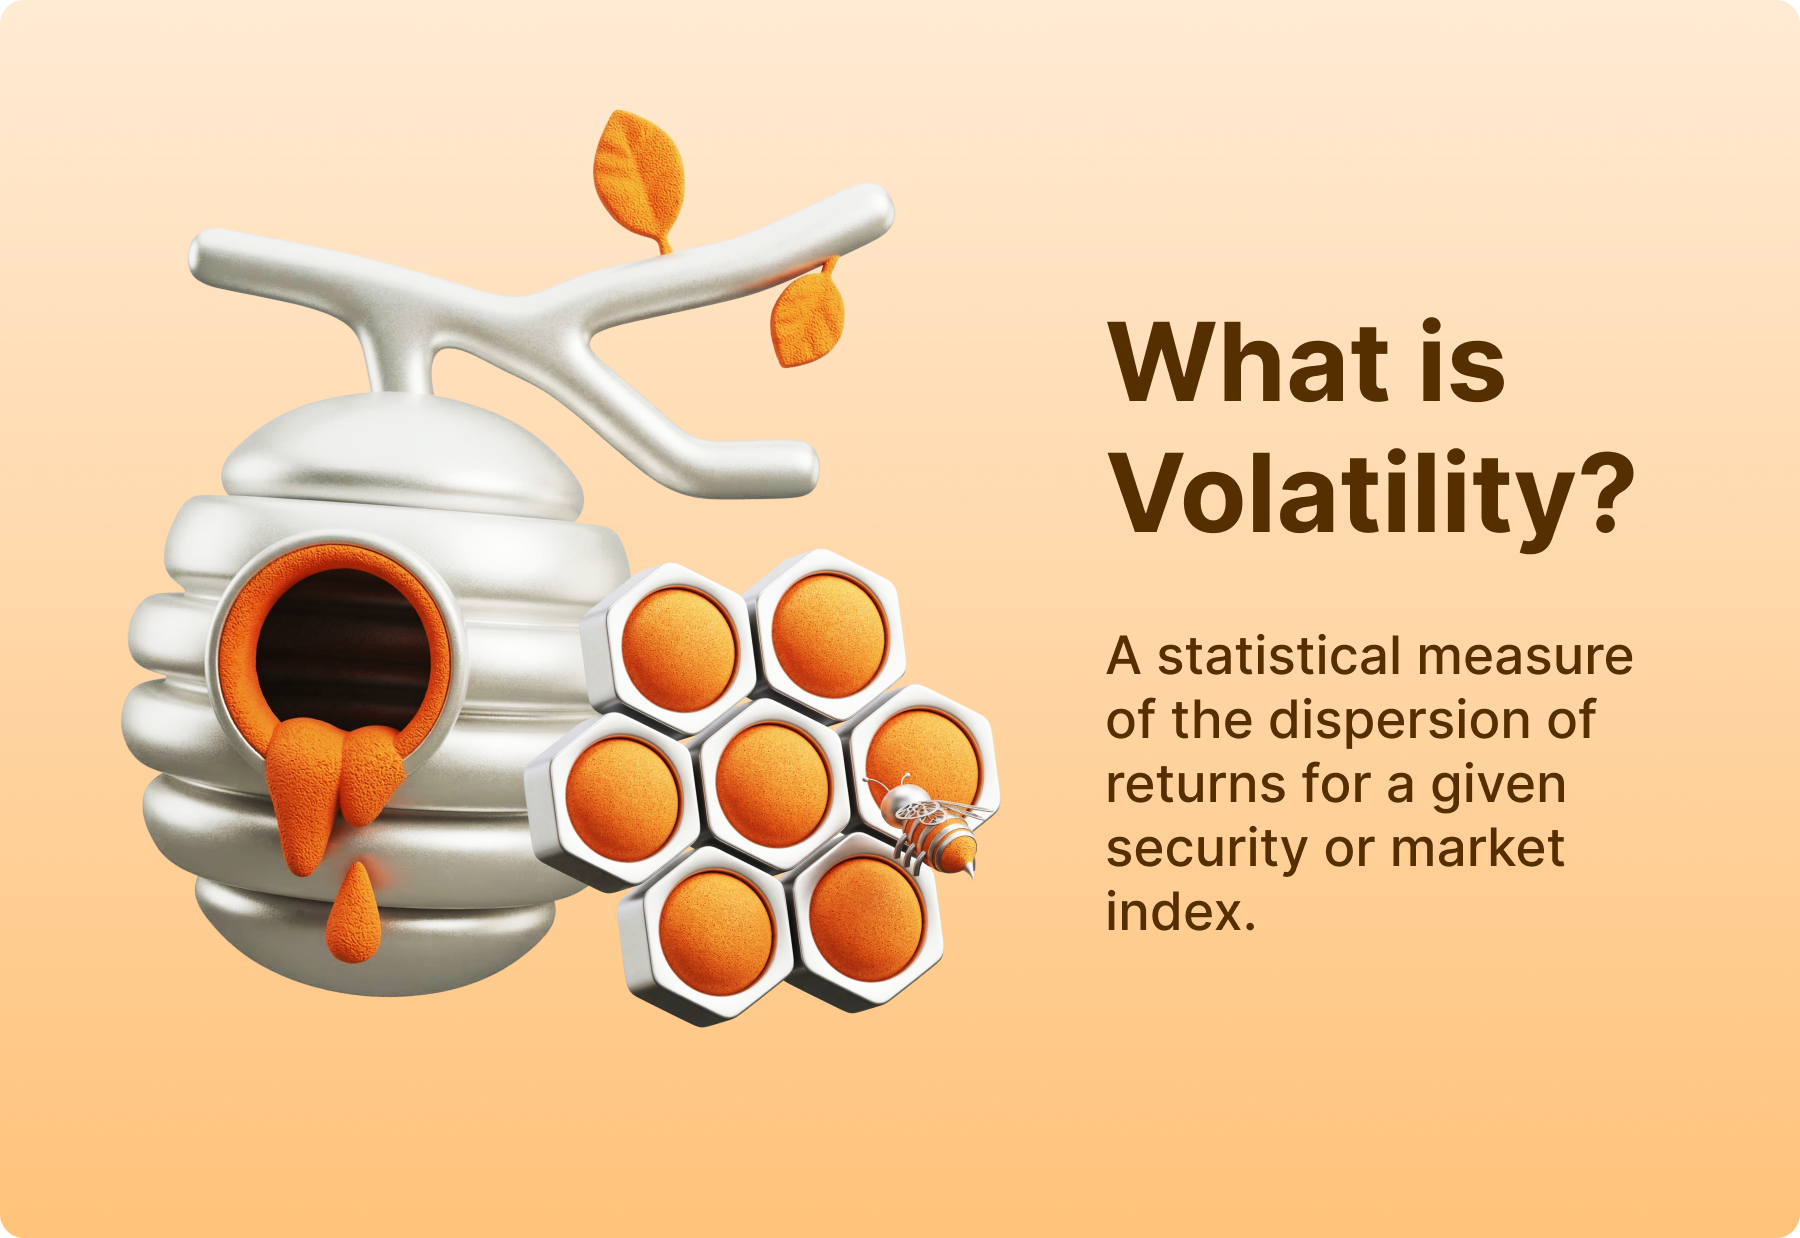
What Is Volatility
Volatility refers to the speed and magnitude of changes in price over a period. When the prices rapidly rise and fall, then volatility is high. When the prices tend to change slowly and remain within narrow confines, then volatility is low.
High volatility means uncertainty. The market reacts faster and can change direction without warning. Low volatility creates a more stable environment where price moves are much smoother and easier to follow.
Volatility does not tell you the direction of the market; it only shows the strength of the movement. That is why volatility is a very important concept: traders want to understand the risk, the position size and the market conditions before entering a trade.
Why Volatility Matters in Trading
Everything about a trade is affected by volatility. When it is high, the moves in price are larger and quicker. This brings both opportunity and risk because one can gain more in a short period of time, though losses too may appear quickly when the market turns against the trader.
High volatility normally creates wide price oscillations, breakouts and rapid changes in trend. The trading environment requires fast decisions with solid risk control. Low volatility translates to tranquil markets, with prices moving slowly and showing more distinguishable patterns. Such periods are typically used for range trading or building positions.
Moreover, position size also depends on volatility: high volatility normally means smaller positions to control the risk, while low volatility might allow higher position sizes because the moves of the price are contained. Understanding volatility helps traders make better decisions on entries, exits and position sizing based on current market behavior.
Types of Volatility
Volatility comes in a number of forms. Each type shows a different view of market behaviour. Knowing the differences helps traders read conditions more accurately.
- Historical Volatility – This is a measure of how much the price has moved historically. It uses past price data to compute the speed at which the market fluctuated during a given time frame. The concept is used by traders in order to gauge the stability or activity of any asset.
- Implied Volatility – Implied volatility is a reflection of what the market expects in the future. It derives from option prices. When traders expect bigger moves, the implied volatility rises. It falls when the market feels calm. Implied volatility often reacts before the price does, making it valuable for forecasting.
- Realized Volatility – Realized volatility is the volatility that actually occurred during a particular period. It is similar to historical volatility except it looks backward to determine the actual price movement experienced during a recent, completed period. Traders use this to confirm whether recent market action was as anticipated.
- Intraday Volatility – Intraday volatility refers to price movement in one single trading session. A few assets show sharp intraday movement, which might not be reflected when their long-term volatility is considered. Intraday volatility assists day traders in planning entry, exit and risk levels more precisely.
How Volatility Is Measured
Volatility is measured with tools that track price movement and help traders understand how active the market is. These tools turn price behavior into clear numbers or visual signals.
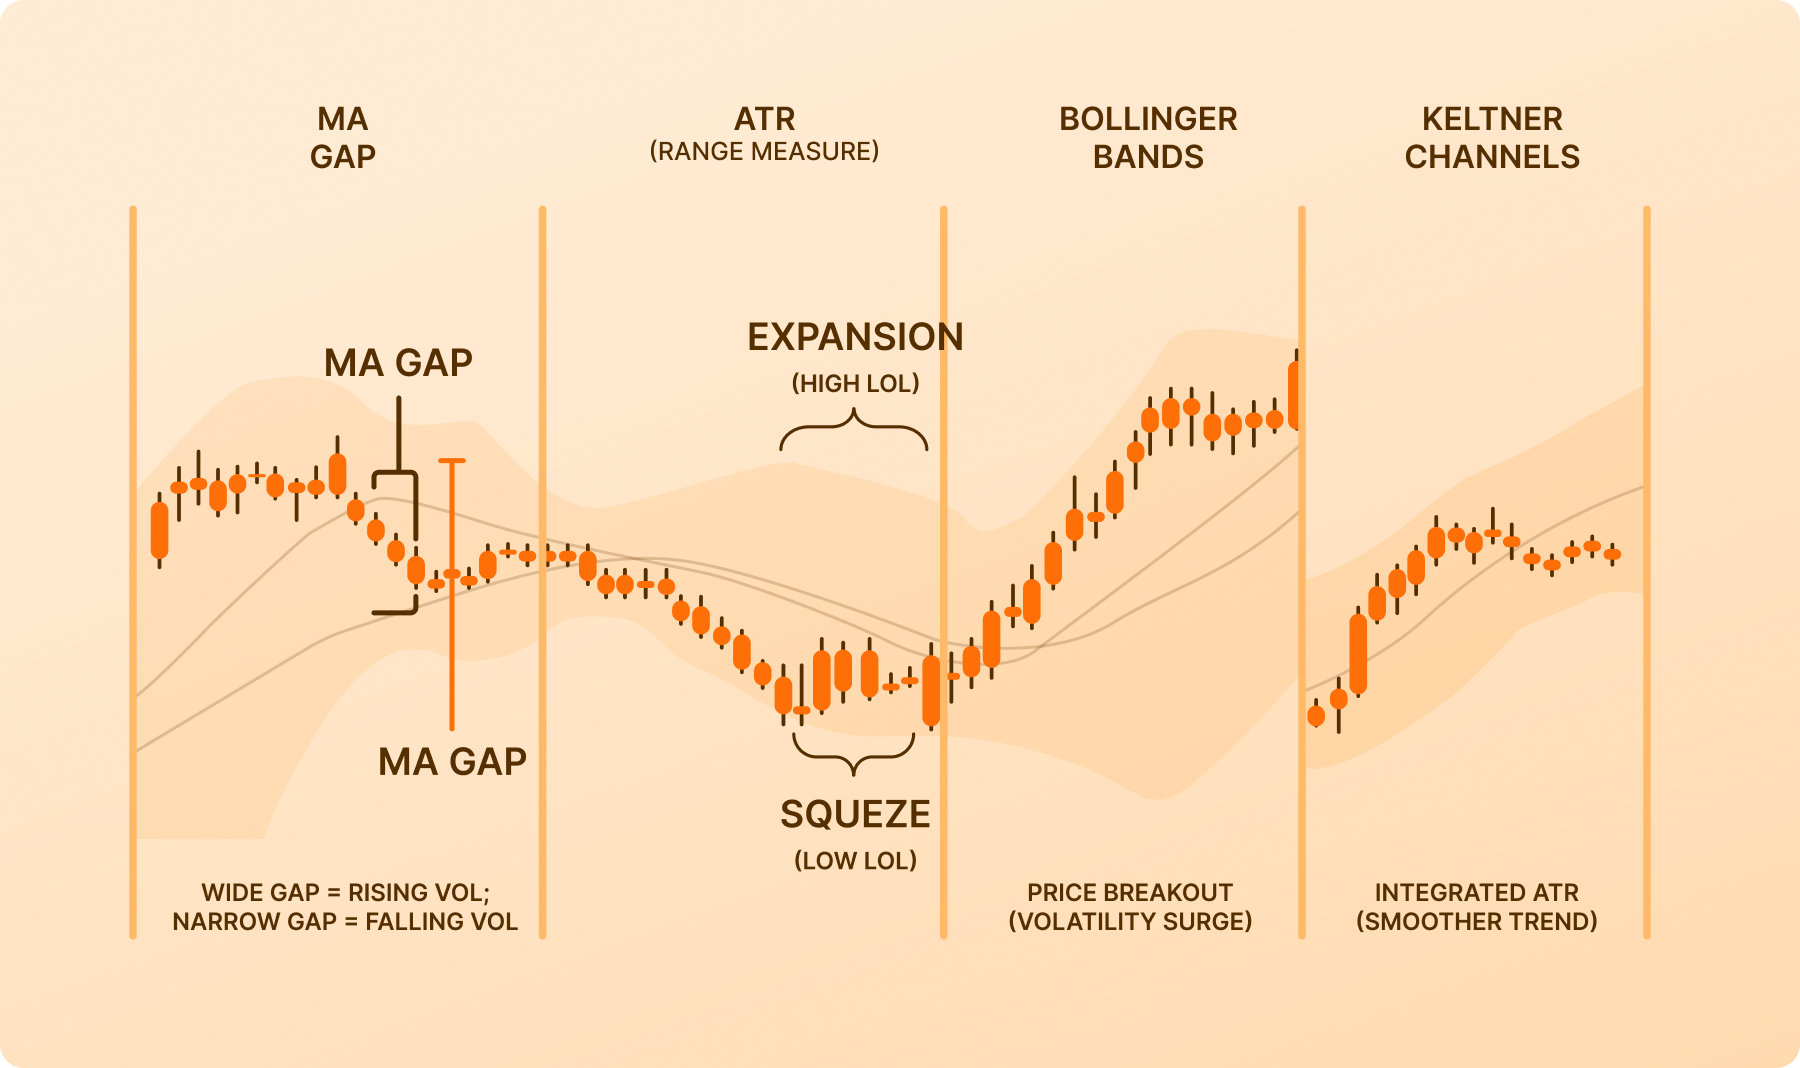
Standard Deviation
Standard deviation calculates how far price moves from its average over a period. A larger standard deviation means wider price swings and higher volatility. A smaller value means calmer markets. Many volatility indicators are based on this calculation.
Average True Range
The average true range or ATR, measures the average size of recent price candles. ATR does not look at direction. It only measures how large each move is. A rising ATR means volatility is increasing. A falling ATR shows the market is becoming more stable.
Bollinger Bands
Bollinger Bands use standard deviation to create a band above and below the price. When the bands widen, volatility has increased; when the bands tighten, volatility has decreased. Bollinger bands help traders identify breakout opportunities or periods of tranquility.
Volatility Indexes
Indexes such as the VIX track expected volatility in major markets. A rising volatility index shows fear and uncertainty. A falling index indicates stable conditions. These tools give traders a broad view of market sentiment.
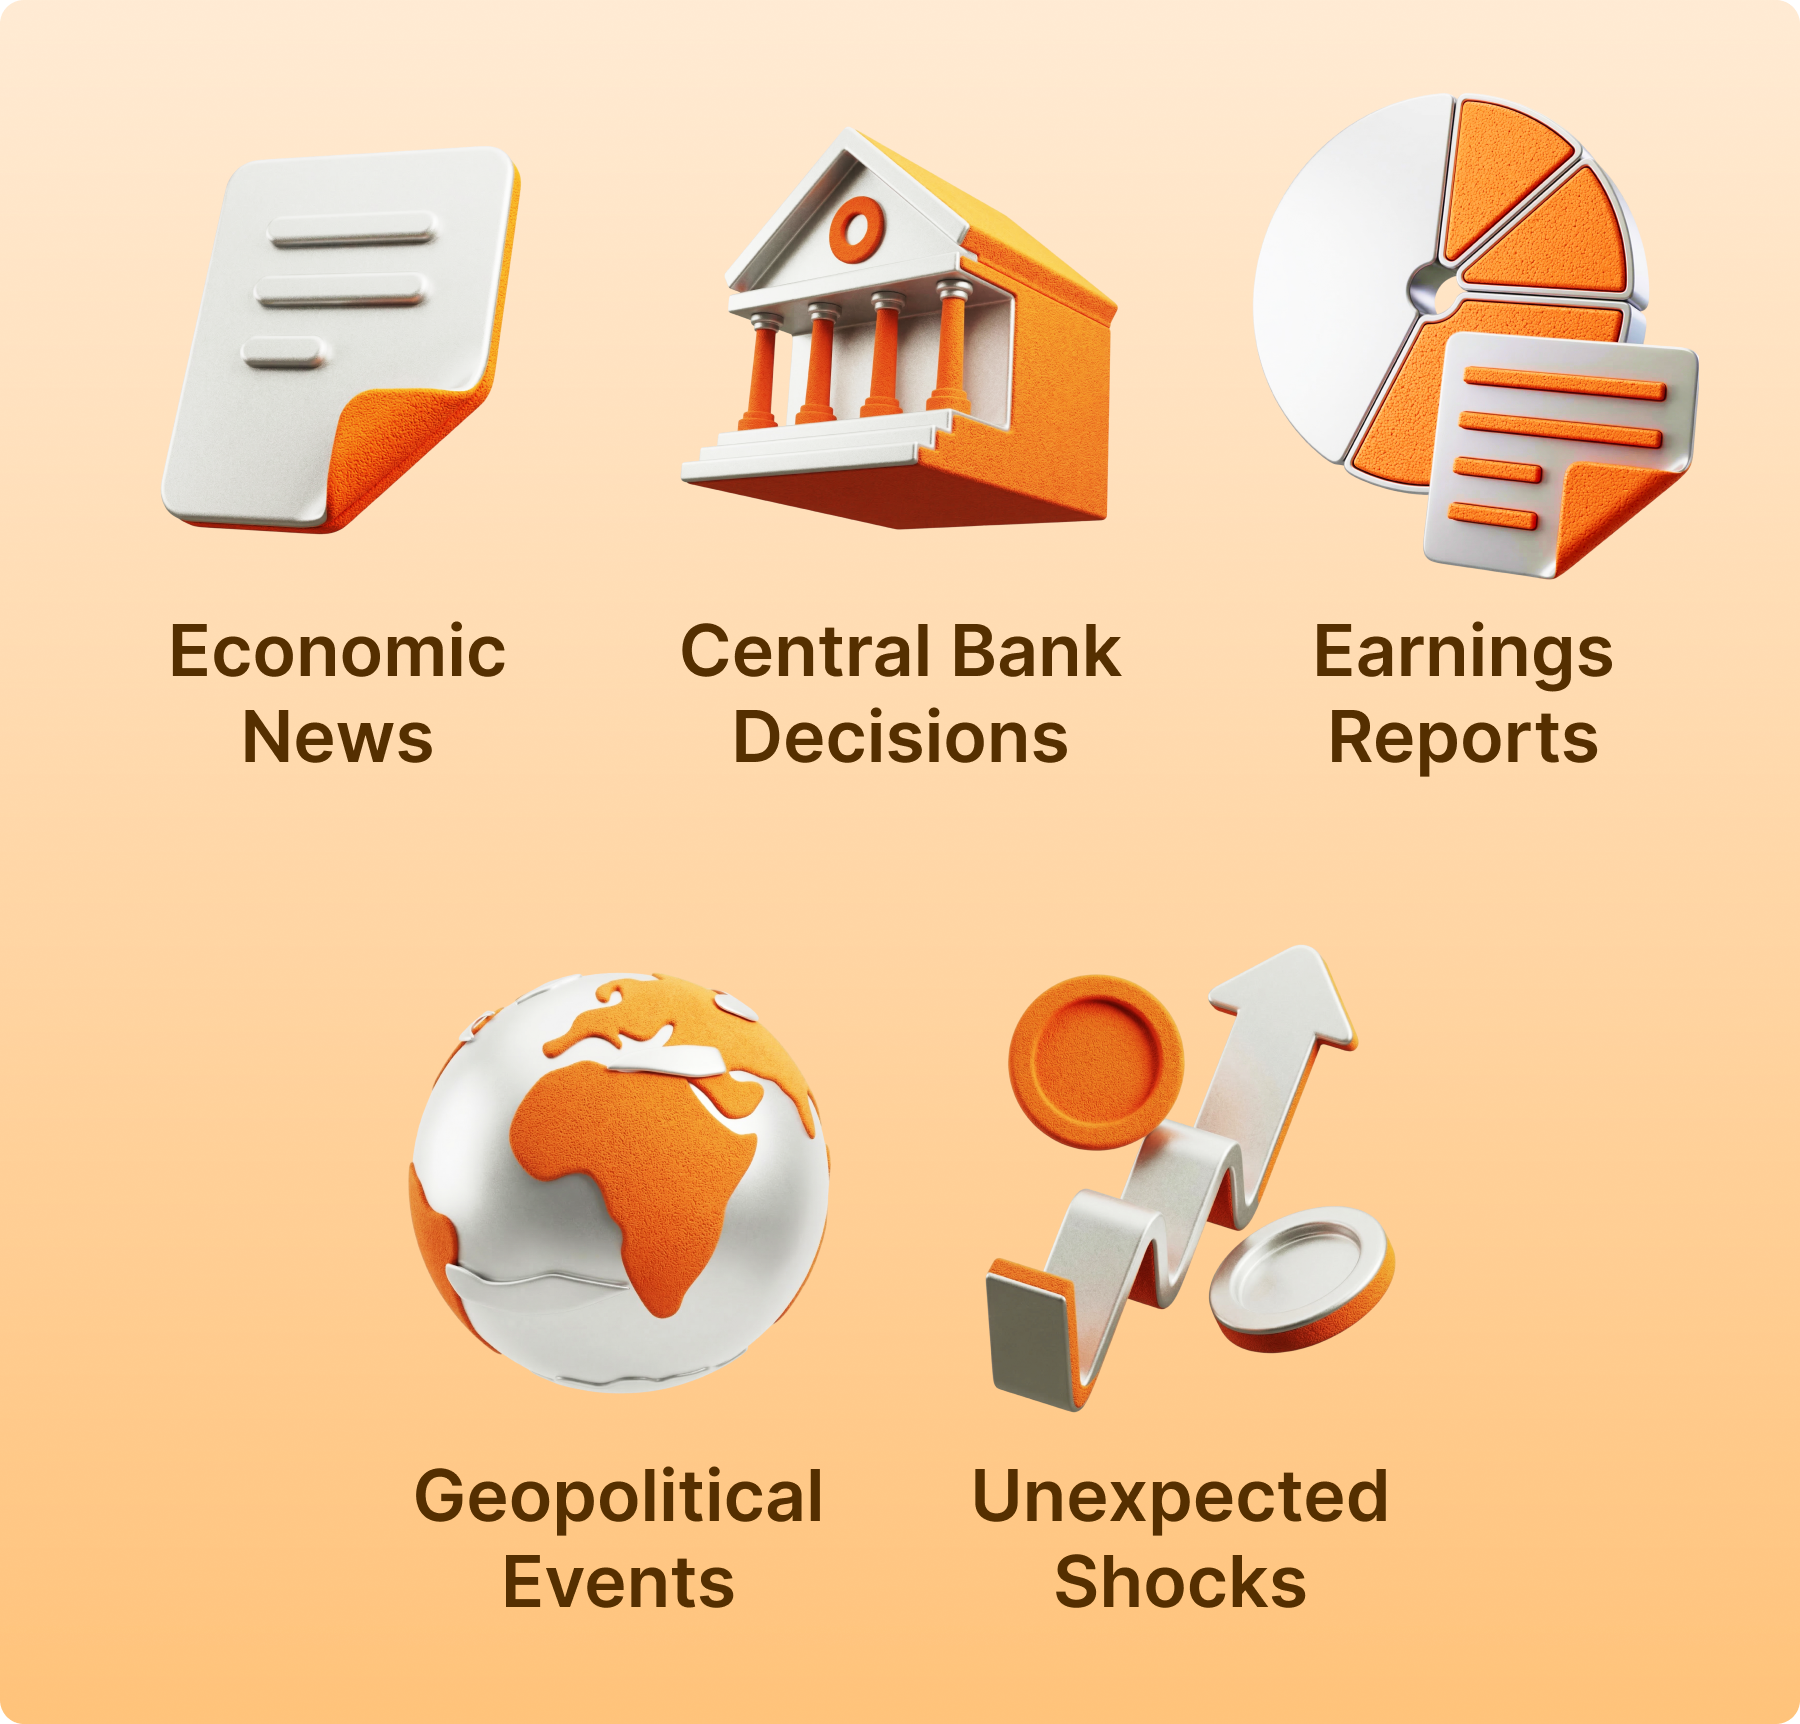
What are the Causes of Market Volatility?
Volatility is a consequence of change in information, sentiment and economic conditions. Knowing the leading causes will help a trader to expect sudden movements and avoid taking unnecessary risks.
- Economic News – Events like inflation data, employment numbers and GDP updates can alter market expectations in a heartbeat. Often, strong or weak results are immediately translated into sharp price swings.
- Central Bank Decisions – Central Bank Decisions-Interest rate changes and policy announcements by central banks have the power to alter the direction of markets. Such decisions affect currency pairs, stocks and commodities and high volatility often characterizes these decisions.
- Earnings Reports – The release of the earnings by the companies might lead to rapid movements in stock prices. Stronger or weaker-than-expected results may further create intense activity on the part of traders and investors.
- Geopolitical Events – Events like elections, conflicts and changes in policy create uncertainty. These uncertainties cause the markets to move fast and unpredictably.
- Unexpected Shocks – Shocks from events that are unforeseen, like natural disasters or large economic surprises, could immediately create volatility. These moves are hard to predict but have major impact.
How Volatility Affects Different Assets
Volatility does not behave the same across all markets. Each asset class responds to news, sentiment and liquidity differently. It is important for a trader to understand the differences in order to select a strategy to use in each market.
Forex Pairs
Major forex pairs often show moderate and steady volatility because they are highly liquid. Minor and exotic pairs can be far more volatile. Economic news and central bank decisions have the strongest impact on forex volatility.
Stocks
Earnings reports, company announcements and sector news can make individual stocks highly volatile. Stocks with lower trading volume are more likely to move aggressively, fewer traders mean bigger price swings.
Crypto
Crypto markets are known to be highly volatile. Prices can rise or fall suddenly based on sentiment, news on regulations or broader market movements. This brings great opportunities for trading but calls for thoughtful risk control.
Commodities
Commodities like gold, oil and natural gas are sensitive to supply and demand changes. Political events, production decisions and weather conditions may lead to sudden volatility. When uncertainty increases, these markets often move sharply.
How Traders Can Use Volatility
The right handling of volatility creates opportunity. Traders can use volatility to find strong moves, find better entries and control risk more effectively.
During periods of high volatility, markets often break through levels of support or resistance. These breakouts are the start of new trends and continuations of existing ones. Increased volatility provides momentum followers with strong setups.
Low volatility usually creates tight ranges. These conditions help traders identify consolidation zones and prepare for future breakouts. Range trading is also more viable in very calm markets, as price tends to shuttle between clearly marked boundaries.
Volatility also serves to assist traders in properly sizing their positions. If volatility is high, then smaller positions will be helpful in protecting your account; if it is low, position sizes may be carefully increased. Using volatility as a guide, it will help traders construct safer and more consistent strategies.
Volatility does not give any indication of the direction, but it does show the activity of the market. Traders who combine volatility signals with trend analysis and proper risk management will gain a stronger understanding of market behavior.
Common Volatility Trading Strategies
Volatility creates different types of market behavior. Traders can use this behavior to build strategies that match current conditions. Each approach works best when volatility reaches specific levels.
- Volatility Breakout Trading – This strategy focuses on price breaking out of tight ranges during periods of rising volatility. When volatility expands, breakouts tend to be stronger and more reliable. Traders look for the price to move beyond resistance or support with increased activity. This approach works well after calm market periods.
- Mean Reversion Trading – When volatility spikes too quickly, price often snaps back toward its average. Mean reversion traders wait for extreme moves and look for signs of exhaustion. This strategy works best when markets overreact to news or sudden changes.
- Range Trading During Low Volatility – Low volatility often forms clear ranges. Traders can buy at the bottom of the range and sell at the top while volatility stays low. This approach requires tight risk control because breakouts can occur once volatility rises.
- Trend Trading in High Volatility – High volatility can push strong trends forward. Trend traders use momentum indicators and price action to follow these moves. The goal is to join the trend early and exit when volatility begins to fall.
Tools and Indicators for Volatility
Traders use specific tools to read volatility and understand how active the market is. These indicators help identify breakouts, reversals and calm periods with more accuracy.
Average True Range
Average true range or ATR, measures the average size of recent price candles. A rising ATR shows that price swings are getting larger. A falling ATR shows that the market is becoming calmer. ATR is useful for setting stop losses and sizing positions.
Bollinger Bands
Bollinger bands expand and contract based on volatility. When the bands widen, volatility increases. When they tighten, volatility decreases. Traders use band patterns to spot breakout conditions or overextended moves.
Donchian Channels
Donchian channels show the highest and lowest prices over a set period. When price breaks outside the channels, it often signals a strong volatility driven move. These channels suit breakout strategies.
Keltner Channels
Keltner channels use ATR to create a smoother volatility envelope around the price. These channels help traders find trends and measure the strength of ongoing moves. They respond more steadily than Bollinger bands.
Moving Average Width
The distance between fast and slow moving averages can reveal volatility shifts. When the gap widens, volatility rises. When the gap narrows, volatility falls. This method helps traders track market pressure changes.
How to Manage Risk in Volatile Markets
Managing risk becomes more important when markets move fast. Volatility increases both opportunity and danger, so traders must adjust their approach to stay protected.
- Use Smaller Position Sizes – When volatility rises, price swings become larger. Smaller positions help limit losses during sudden moves. This keeps risk steady even when the market becomes unpredictable.
- Widen Stop Loss Levels – Tight stops can get triggered quickly in volatile markets. Wider stops allow the trade more room to move without closing too early. This adjustment should always be paired with smaller position sizes to keep the same level of risk.
- Scale In and Out of Trades – Entering a trade in parts can reduce pressure during high volatility. Scaling out also helps secure profit while still keeping part of the position open if the move continues.
- Avoid Trading During Major News – Economic reports and central bank announcements can create extreme volatility. Many traders avoid opening new trades during these moments because price can jump in both directions. Waiting for the market to settle often brings clearer conditions.
- Stay Disciplined – Volatile markets can push traders to react emotionally. Following a clear plan reduces mistakes. Discipline helps you avoid chasing moves or opening trades without strong signals.
Volatility on the IQ Option Platform
The IQ Option platform gives traders several tools to understand and react to volatility. You can view live charts, apply indicators and track how wide or narrow market movements are. Indicators such as ATR, Bollinger bands and moving averages are available directly on the chart. These tools help you see when volatility is rising or falling.
Traders can also test volatility-based strategies on a practice account. This allows you to see how your strategy behaves during fast markets without risking real funds. You can switch between assets, compare volatility levels and study how different markets react to news.
Conclusion
One of the most important concepts in trading is volatility. It shows how active the market is, how fast the price moves and how much risk traders face at any moment. High volatility creates fast opportunities but requires strong discipline. Low volatility creates calm markets, which often lead to new breakouts or clear ranges.
Understanding volatility assists the trader in choosing better strategies and adjusting position size and risk management more effectively. By merging volatility analysis along with indicators, trend direction and clear rules, traders can therefore make smarter decisions on IQ Option and stand prepared to confidently handle changing market conditions.